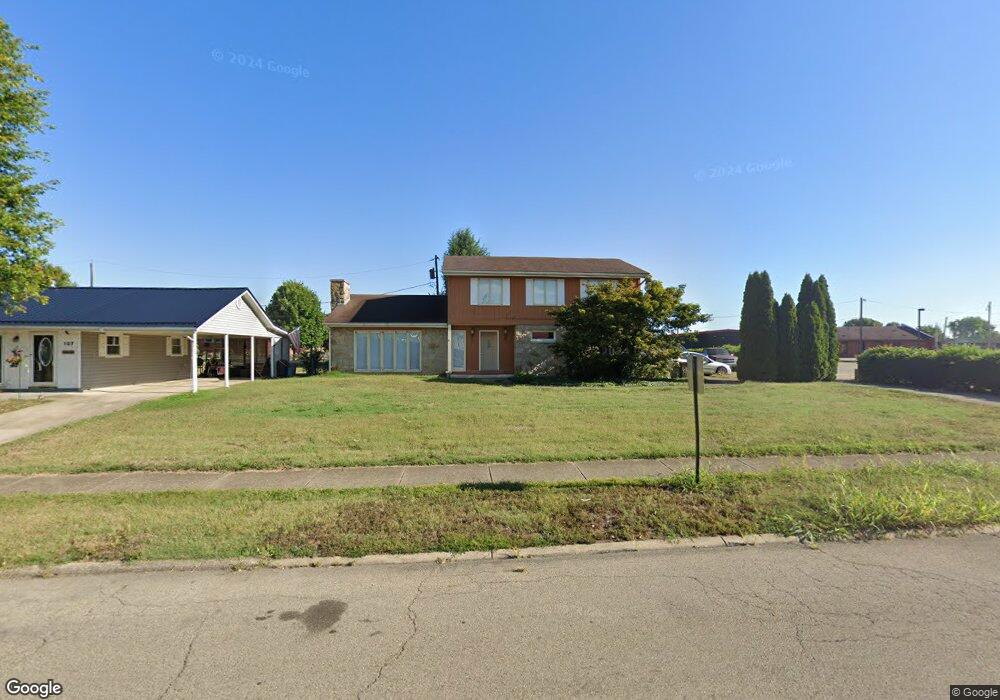
105 Thornton Dr Piketon, OH 45661
Estimated Value: $214,000 - $273,000
4
Beds
3
Baths
1,782
Sq Ft
$139/Sq Ft
Est. Value
About This Home
This home is located at 105 Thornton Dr, Piketon, OH 45661 and is currently estimated at $246,952, approximately $138 per square foot. 105 Thornton Dr is a home located in Pike County with nearby schools including Jasper Elementary School, Zahns Middle School, and Piketon Junior/Senior High School.
Ownership History
Date
Name
Owned For
Owner Type
Purchase Details
Closed on
Oct 23, 2020
Sold by
Marshall Kiley Paige and Marshall William Scott
Bought by
Moore Denver Lee and Moore Heather L
Current Estimated Value
Home Financials for this Owner
Home Financials are based on the most recent Mortgage that was taken out on this home.
Original Mortgage
$161,500
Outstanding Balance
$115,825
Interest Rate
2.8%
Mortgage Type
Future Advance Clause Open End Mortgage
Estimated Equity
$131,127
Purchase Details
Closed on
Aug 3, 2012
Sold by
Ratliff Randall S and Ratliff Stacey L
Bought by
Arthur Kiley P
Home Financials for this Owner
Home Financials are based on the most recent Mortgage that was taken out on this home.
Original Mortgage
$178,217
Interest Rate
3.65%
Mortgage Type
New Conventional
Purchase Details
Closed on
May 10, 2010
Sold by
Brushart James A and Brushart Jo Ann
Bought by
Ratliff Randall S and Ratliff Stacey L
Home Financials for this Owner
Home Financials are based on the most recent Mortgage that was taken out on this home.
Original Mortgage
$169,308
Interest Rate
5.16%
Mortgage Type
New Conventional
Create a Home Valuation Report for This Property
The Home Valuation Report is an in-depth analysis detailing your home's value as well as a comparison with similar homes in the area
Home Values in the Area
Average Home Value in this Area
Purchase History
| Date | Buyer | Sale Price | Title Company |
|---|---|---|---|
| Moore Denver Lee | $182,000 | None Available | |
| Arthur Kiley P | -- | None Available | |
| Ratliff Randall S | $169,900 | None Available |
Source: Public Records
Mortgage History
| Date | Status | Borrower | Loan Amount |
|---|---|---|---|
| Open | Moore Denver Lee | $161,500 | |
| Closed | Arthur Kiley P | $178,217 | |
| Previous Owner | Ratliff Randall S | $169,308 |
Source: Public Records
Tax History Compared to Growth
Tax History
| Year | Tax Paid | Tax Assessment Tax Assessment Total Assessment is a certain percentage of the fair market value that is determined by local assessors to be the total taxable value of land and additions on the property. | Land | Improvement |
|---|---|---|---|---|
| 2024 | $2,578 | $68,650 | $8,790 | $59,860 |
| 2023 | $2,578 | $68,650 | $8,790 | $59,860 |
| 2022 | $1,791 | $45,180 | $4,930 | $40,250 |
| 2021 | $1,743 | $45,180 | $4,930 | $40,250 |
| 2020 | $1,745 | $45,180 | $4,930 | $40,250 |
| 2019 | $1,444 | $38,520 | $4,290 | $34,230 |
| 2018 | $1,463 | $38,520 | $4,290 | $34,230 |
| 2017 | $1,458 | $38,520 | $4,290 | $34,230 |
| 2016 | $1,513 | $41,210 | $5,880 | $35,330 |
| 2015 | $1,514 | $41,210 | $5,880 | $35,330 |
| 2014 | $1,538 | $41,210 | $5,880 | $35,330 |
| 2013 | $1,558 | $41,210 | $5,880 | $35,330 |
| 2012 | $1,607 | $41,210 | $5,880 | $35,330 |
Source: Public Records
Map
Nearby Homes
- 1444 U S Rt 23 S
- 214 N Lucas
- 0 Sr 23 Unit 152720
- 1149 Piketon Rd Unit N
- 207 Fitch St
- 3024 Shyville Rd
- 2016 Shyville Rd
- 520 Valley View Dr
- 106 Randall Dr
- 194 Pine St
- 7132 Ohio 104
- 134 Sugar Run Rd Unit C42
- 0 Long Fork Rd
- 2351 Beaver Creek Rd
- 1291 Sugar Run Rd Unit 42
- 3516 Sugar Run Rd
- 4405 Us Route 23
- 2590 Zahns Corner Rd Unit 220562
- 13686 Ohio 220
- 0 Rd Unit 198381
- 107 Thornton Dr
- 109 Thornton Dr
- 530 Marple Ave
- 625 West St
- 111 Thornton Dr
- 522 Marple Ave
- 104 Thornton Dr
- 613 S West St Unit SMOKEY
- 106 Thornton Dr
- 108 Thornton Dr
- 529 Seal Ave
- 113 Thornton Dr
- 527 Seal Ave
- 0 West St
- 557 West St
- 520 Marple Ave
- 110 Thornton Dr
- 523 Marple Ave
- 112 Thornton Dr
- 525 Seal Ave