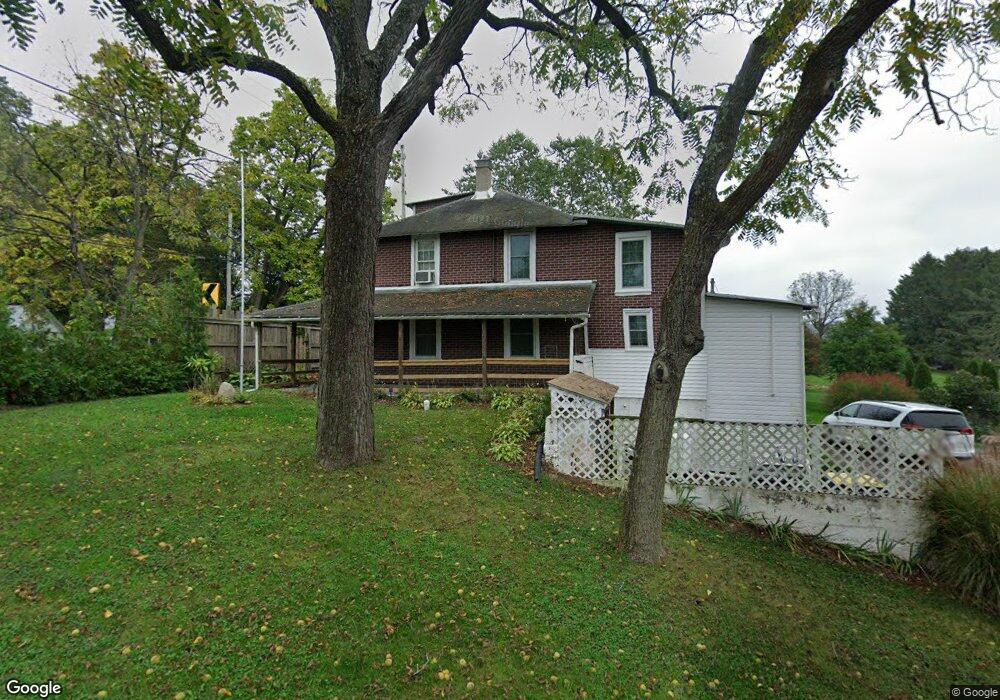
105 Trout Run Rd Boyertown, PA 19512
Estimated Value: $288,783 - $327,000
5
Beds
2
Baths
1,554
Sq Ft
$198/Sq Ft
Est. Value
About This Home
This home is located at 105 Trout Run Rd, Boyertown, PA 19512 and is currently estimated at $308,446, approximately $198 per square foot. 105 Trout Run Rd is a home located in Berks County with nearby schools including Boyertown Area Senior High School, Jessie R Wagner Adventist Elementary School, and Pine Forge Academy.
Ownership History
Date
Name
Owned For
Owner Type
Purchase Details
Closed on
Oct 23, 2020
Sold by
Dierolf John E
Bought by
Avans Anthony
Current Estimated Value
Home Financials for this Owner
Home Financials are based on the most recent Mortgage that was taken out on this home.
Original Mortgage
$196,910
Outstanding Balance
$174,421
Interest Rate
2.8%
Mortgage Type
New Conventional
Estimated Equity
$134,025
Purchase Details
Closed on
Aug 16, 2010
Sold by
Reitnauer Frances S and Washler Sandra A
Bought by
Dierolf John E
Home Financials for this Owner
Home Financials are based on the most recent Mortgage that was taken out on this home.
Original Mortgage
$138,040
Interest Rate
4.87%
Mortgage Type
FHA
Create a Home Valuation Report for This Property
The Home Valuation Report is an in-depth analysis detailing your home's value as well as a comparison with similar homes in the area
Home Values in the Area
Average Home Value in this Area
Purchase History
| Date | Buyer | Sale Price | Title Company |
|---|---|---|---|
| Avans Anthony | $203,000 | None Listed On Document | |
| Dierolf John E | $139,900 | None Available |
Source: Public Records
Mortgage History
| Date | Status | Borrower | Loan Amount |
|---|---|---|---|
| Open | Avans Anthony | $196,910 | |
| Previous Owner | Dierolf John E | $138,040 |
Source: Public Records
Tax History Compared to Growth
Tax History
| Year | Tax Paid | Tax Assessment Tax Assessment Total Assessment is a certain percentage of the fair market value that is determined by local assessors to be the total taxable value of land and additions on the property. | Land | Improvement |
|---|---|---|---|---|
| 2025 | $1,013 | $72,800 | $42,800 | $30,000 |
| 2024 | $3,208 | $72,800 | $42,800 | $30,000 |
| 2023 | $3,092 | $72,800 | $42,800 | $30,000 |
| 2022 | $3,029 | $72,800 | $42,800 | $30,000 |
| 2021 | $2,960 | $72,800 | $42,800 | $30,000 |
| 2020 | $2,860 | $72,800 | $42,800 | $30,000 |
| 2019 | $2,790 | $72,800 | $42,800 | $30,000 |
| 2018 | $2,692 | $72,800 | $42,800 | $30,000 |
| 2017 | $2,544 | $72,800 | $42,800 | $30,000 |
| 2016 | $761 | $72,800 | $42,800 | $30,000 |
| 2015 | $761 | $72,800 | $42,800 | $30,000 |
| 2014 | $690 | $72,800 | $42,800 | $30,000 |
Source: Public Records
Map
Nearby Homes
- 1041 Reading Ave
- 7816 Boyertown Pike
- 1008 Reading Ave
- 141 Greshville Rd
- 108 Highland Ct
- 31 Allegheny St
- 157 Forage Cir
- 332 S Reading Ave
- 2 Machamer Rd
- 314 Haven Dr
- Laurel Plan at Pottsgrove Hunt - 55+
- NEUVILLE Plan at Pottsgrove Hunt - 55+
- Lismore Plan at Pottsgrove Hunt - 55+
- 302 Haven Dr
- 296 Haven Dr
- 290 Haven Dr
- 318 Haven Dr
- 284 Haven Dr
- 35 Winding Creek Dr
- 278 Haven Dr
- 105 Trout Run Rd
- 1225 Reading Ave
- 1225 Reading Ave
- 1241 Reading Ave
- 93 Trout Run Rd
- 1218 Reading Ave
- 1247 Reading Ave
- 1251 Reading Ave
- 1253 Reading Ave
- 1204 Reading Ave
- 1259 Reading Ave
- 1200 Reading Ave
- 84 Wilcox Rd
- 80 Wilcox Rd
- 76 Wilcox Rd
- 40 Borick Dr
- 72 Wilcox Rd
- 1273 Reading Ave
- 1273 Reading Ave
- 83 Wilcox Rd