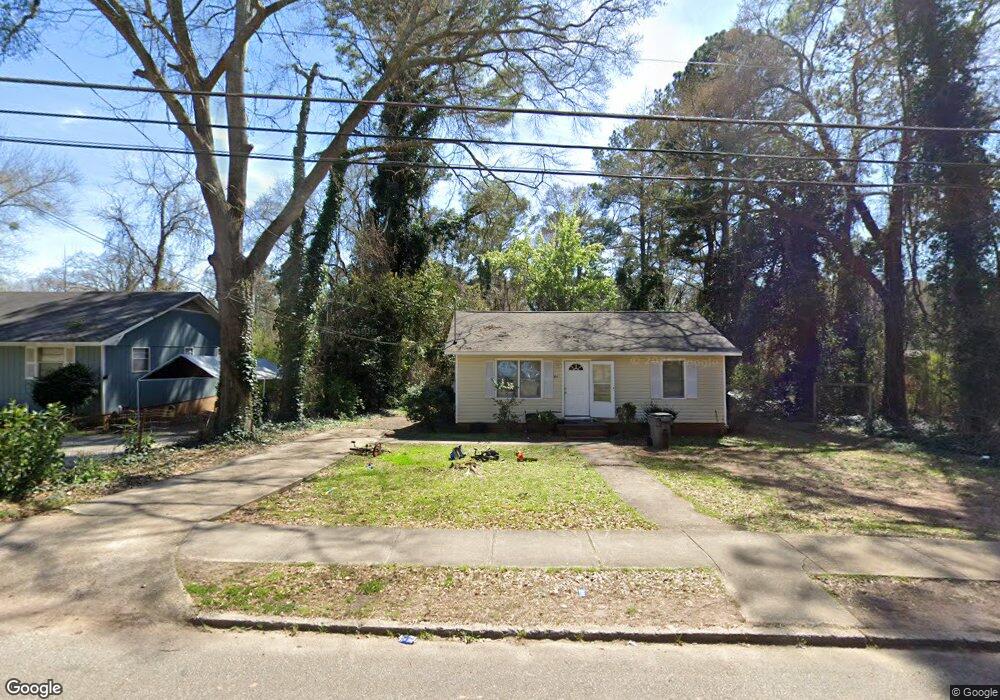
105 Turner St Lagrange, GA 30240
Estimated Value: $94,000 - $149,000
2
Beds
1
Bath
964
Sq Ft
$126/Sq Ft
Est. Value
About This Home
This home is located at 105 Turner St, Lagrange, GA 30240 and is currently estimated at $121,179, approximately $125 per square foot. 105 Turner St is a home located in Troup County with nearby schools including Franklin Forest Elementary School, Hollis Hand Elementary School, and Ethel W. Kight Elementary School.
Ownership History
Date
Name
Owned For
Owner Type
Purchase Details
Closed on
Mar 10, 2021
Sold by
Daniel Linda Morrow Estate
Bought by
Daniel William Oneal
Current Estimated Value
Purchase Details
Closed on
Jul 27, 2004
Sold by
Neal Daniel
Bought by
Daniel Neal and Daniel Linda M
Purchase Details
Closed on
May 18, 2004
Sold by
Brice Edwin Mapp
Bought by
Neal Daniel
Purchase Details
Closed on
Sep 10, 1997
Sold by
Donz Inc & Perry Bradley
Bought by
Brice Edwin Mapp
Purchase Details
Closed on
Sep 26, 1996
Sold by
Davenport Wilbert
Bought by
Donz Inc & Perry Bradley
Purchase Details
Closed on
Dec 23, 1993
Sold by
Newman A
Bought by
Davenport Wilbert
Purchase Details
Closed on
Dec 15, 1987
Sold by
Lois E Simmons
Bought by
Newman A
Purchase Details
Closed on
Jan 1, 1985
Sold by
Lois E Simmons Exec
Bought by
Lois E Simmons
Purchase Details
Closed on
Jan 1, 1960
Bought by
Lois E Simmons Exec
Purchase Details
Closed on
Jan 1, 1959
Sold by
Enry Turner W and Enry Rhoney
Create a Home Valuation Report for This Property
The Home Valuation Report is an in-depth analysis detailing your home's value as well as a comparison with similar homes in the area
Purchase History
| Date | Buyer | Sale Price | Title Company |
|---|---|---|---|
| Daniel William Oneal | -- | -- | |
| Daniel Neal | -- | -- | |
| Neal Daniel | $26,000 | -- | |
| Brice Edwin Mapp | -- | -- | |
| Donz Inc & Perry Bradley | $4,500 | -- | |
| Davenport Wilbert | $43,800 | -- | |
| Newman A | $31,300 | -- | |
| Lois E Simmons | -- | -- | |
| Lois E Simmons Exec | -- | -- | |
| -- | -- | -- |
Source: Public Records
Tax History
| Year | Tax Paid | Tax Assessment Tax Assessment Total Assessment is a certain percentage of the fair market value that is determined by local assessors to be the total taxable value of land and additions on the property. | Land | Improvement |
|---|---|---|---|---|
| 2025 | $905 | $33,200 | $3,480 | $29,720 |
| 2024 | $747 | $27,400 | $3,480 | $23,920 |
| 2023 | $592 | $21,720 | $3,480 | $18,240 |
| 2022 | $576 | $20,640 | $3,480 | $17,160 |
| 2021 | $477 | $15,800 | $3,480 | $12,320 |
| 2020 | $477 | $15,800 | $3,480 | $12,320 |
| 2019 | $419 | $13,880 | $3,000 | $10,880 |
| 2018 | $419 | $13,880 | $3,000 | $10,880 |
| 2017 | $419 | $13,880 | $3,000 | $10,880 |
| 2016 | $408 | $13,531 | $3,000 | $10,531 |
| 2015 | $421 | $13,951 | $3,420 | $10,531 |
| 2014 | $412 | $13,618 | $3,420 | $10,198 |
| 2013 | -- | $14,583 | $3,420 | $11,163 |
Source: Public Records
Map
Nearby Homes
- 900 North St
- 110 Russell St
- 222 Beechwood Cir
- 106 Ewing St
- 109 Thomas St
- 204 Colonial St
- 724 Camellia Dr
- 219 Banks St
- 732 Camellia Dr
- 806 New Franklin Rd
- 202 Park Hill Dr
- 114 Briarcliff Rd
- 102 Dogwood Dr
- 201 S Chilton Crescent
- 0 Ridley Ave Unit 10550104
- 203 S Chilton Crescent
- 609 Ridley Ave
- 707 Ridley Ave
- 611 Ridley Ave
- 615 Ridley Ave
- 103 Turner St
- 115 Turner St
- 101 Turner St
- 102 Turner St
- 100 Turner St
- 825 N Greenwood St
- 129 Turner St
- 821 N Greenwood St
- 901 Mooty Bridge Rd
- 0 Turner St Unit 129 & 133 7479295
- 909 Mooty Bridge Rd
- 133 Turner St
- 905 Mooty Bridge Rd
- 911 Mooty Bridge Rd
- 911 N Greenwood St
- 137 Turner St
- 811 N Greenwood St
- 820 N Greenwood St
- 139 Turner St
- 816 N Greenwood St
Your Personal Tour Guide
Ask me questions while you tour the home.