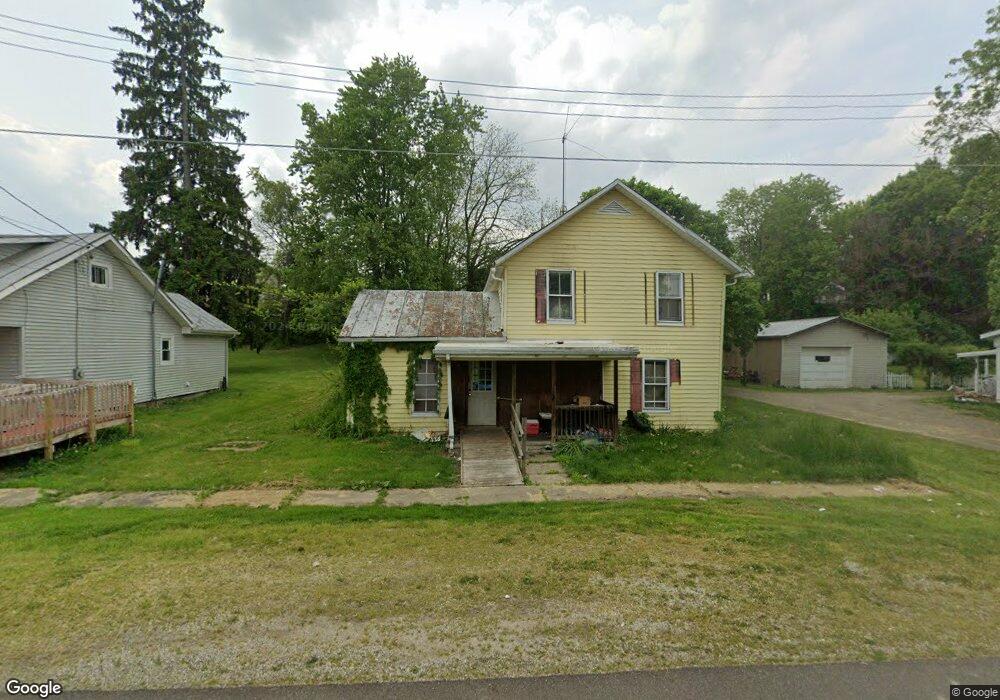
105 Union St Butler, OH 44822
Estimated Value: $77,000 - $166,000
About This Home
This home is located at 105 Union St, Butler, OH 44822 and is currently estimated at $133,747, approximately $116 per square foot. 105 Union St is a home with nearby schools including Clear Fork High School.
Ownership History
We collect this data history from publicly available records. To have your information removed, we recommend requesting removal directly through your county’s website.
Purchase Details
Purchase Details
Home Financials for this Owner
Home Financials are based on the most recent Mortgage that was taken out on this home.Purchase Details
Purchase Details
Purchase History
We collect this data history from publicly available records. To have your information removed, we recommend requesting removal directly through your county’s website.
| Date | Buyer | Sale Price | Title Company |
|---|---|---|---|
| -- | None Available | ||
| $44,500 | Valmer Land Title Agency | ||
| $30,000 | -- | ||
| -- | -- |
Mortgage History
We collect this data history from publicly available records. To have your information removed, we recommend requesting removal directly through your county’s website.
| Date | Status | Borrower | Loan Amount |
|---|---|---|---|
| Previous Owner | $45,300 | ||
| Previous Owner | $40,000 | ||
| Previous Owner | $31,900 |
Tax History
We collect this data history from publicly available records. To have your information removed, we recommend requesting removal directly through your county’s website.
| Year | Tax Paid | Tax Assessment Tax Assessment Total Assessment is a certain percentage of the fair market value that is determined by local assessors to be the total taxable value of land and additions on the property. | Land | Improvement |
|---|---|---|---|---|
| 2025 | $1,023 | $24,890 | $5,600 | $19,290 |
| 2024 | $1,023 | $24,890 | $5,600 | $19,290 |
| 2023 | $1,023 | $24,890 | $5,600 | $19,290 |
| 2022 | $891 | $20,580 | $5,320 | $15,260 |
| 2021 | $962 | $20,580 | $5,320 | $15,260 |
| 2020 | $962 | $20,580 | $5,320 | $15,260 |
| 2019 | $874 | $17,600 | $4,500 | $13,100 |
| 2018 | $844 | $17,600 | $4,500 | $13,100 |
| 2017 | $784 | $17,600 | $4,500 | $13,100 |
| 2016 | $772 | $17,160 | $4,370 | $12,790 |
| 2015 | $771 | $17,160 | $4,370 | $12,790 |
| 2014 | $769 | $17,160 | $4,370 | $12,790 |
| 2012 | $384 | $17,680 | $4,500 | $13,180 |
Map
- 87 Cleveland St
- 56 Steven Dr
- 1989 Cassell Rd
- 1839 Cutnaw Rd
- 2505 Ramsey Rd
- 5449 Hagerman Rd
- 1260 State Route 97 E Unit Lot 3
- 5042 Possum Run Rd
- 0 Swank Rd
- 21625 N Liberty Rd
- 21625 N Liberty Rd
- 4658 Possum Run Rd
- 7525 95 Rd Unit Butcher Knife
- 0 Mishey Rd
- 0 Hastings E Unit 9073678
- 0 Kenton Rd
- 3844 Pleasant Hill Rd
- 6723 Ankneytown Rd
- 97 Hamilton Dr
- 0 State Route 97 E
Ask me questions while you tour the home.