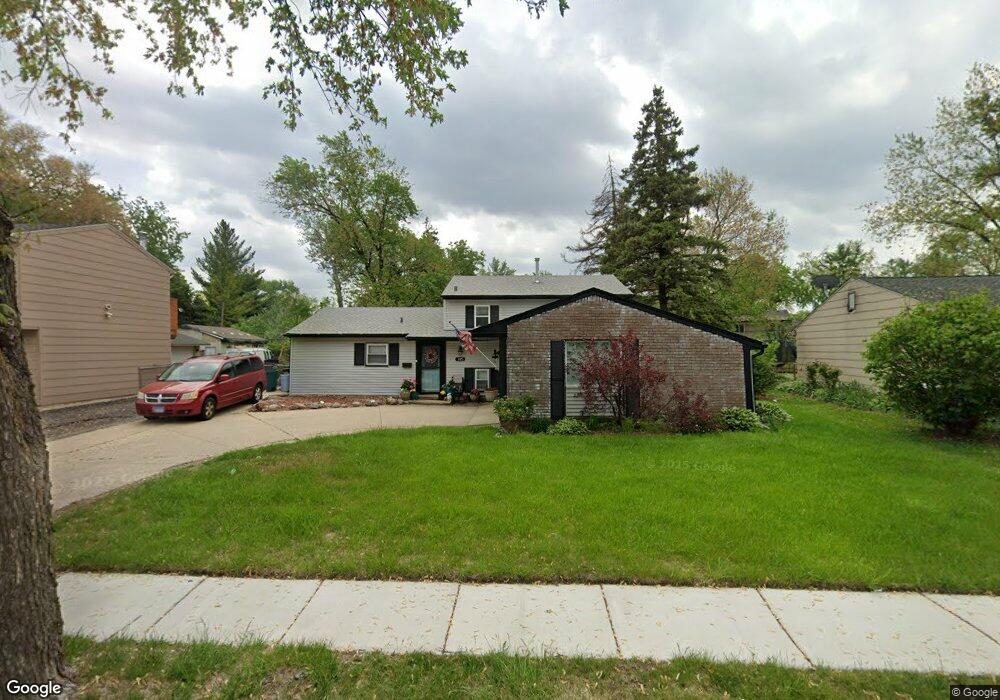
105 Vantroba Dr Glendale Heights, IL 60139
Estimated Value: $318,000 - $363,000
3
Beds
2
Baths
1,632
Sq Ft
$210/Sq Ft
Est. Value
About This Home
This home is located at 105 Vantroba Dr, Glendale Heights, IL 60139 and is currently estimated at $342,099, approximately $209 per square foot. 105 Vantroba Dr is a home located in DuPage County with nearby schools including Glen Hill Primary School, Americana Intermediate School, and Glenside Middle School.
Ownership History
Date
Name
Owned For
Owner Type
Purchase Details
Closed on
Jul 18, 2017
Sold by
Gateley Charles Allen and Gateley Melody Grace
Bought by
Gateley Charles Allen and Gateley Melody Grace
Current Estimated Value
Purchase Details
Closed on
Feb 16, 2004
Sold by
Gateley Charles Allen and Gateley Melody Grace
Bought by
Gateley Charles Allen and Gateley Melody Grace
Purchase Details
Closed on
Jul 9, 1999
Sold by
Reedus Bruce A and Reedus Connie E
Bought by
Gateley Charles A and Gateley Melody G
Home Financials for this Owner
Home Financials are based on the most recent Mortgage that was taken out on this home.
Original Mortgage
$126,300
Outstanding Balance
$35,741
Interest Rate
7.69%
Estimated Equity
$306,358
Purchase Details
Closed on
Dec 16, 1993
Sold by
Ahmed Riaz and Ahmed Zahid N
Bought by
Reedus Bruce A and Reedus Connie E
Home Financials for this Owner
Home Financials are based on the most recent Mortgage that was taken out on this home.
Original Mortgage
$109,180
Interest Rate
7.35%
Mortgage Type
FHA
Create a Home Valuation Report for This Property
The Home Valuation Report is an in-depth analysis detailing your home's value as well as a comparison with similar homes in the area
Home Values in the Area
Average Home Value in this Area
Purchase History
| Date | Buyer | Sale Price | Title Company |
|---|---|---|---|
| Gateley Charles Allen | -- | Attorney | |
| Gateley Charles Allen | -- | -- | |
| Gateley Charles A | $158,000 | First American Title Ins | |
| Reedus Bruce A | $110,500 | First American Title Insuran |
Source: Public Records
Mortgage History
| Date | Status | Borrower | Loan Amount |
|---|---|---|---|
| Open | Gateley Charles A | $126,300 | |
| Previous Owner | Reedus Bruce A | $109,180 |
Source: Public Records
Tax History Compared to Growth
Tax History
| Year | Tax Paid | Tax Assessment Tax Assessment Total Assessment is a certain percentage of the fair market value that is determined by local assessors to be the total taxable value of land and additions on the property. | Land | Improvement |
|---|---|---|---|---|
| 2024 | $7,316 | $95,966 | $23,915 | $72,051 |
| 2023 | $6,987 | $87,760 | $21,870 | $65,890 |
| 2022 | $5,610 | $66,910 | $19,580 | $47,330 |
| 2021 | $3,837 | $18,600 | $18,600 | $0 |
| 2020 | $3,686 | $43,170 | $18,150 | $25,020 |
| 2019 | $5,521 | $61,080 | $17,440 | $43,640 |
| 2018 | $6,534 | $64,090 | $16,980 | $47,110 |
| 2017 | $6,334 | $59,400 | $15,740 | $43,660 |
| 2016 | $6,088 | $54,980 | $14,570 | $40,410 |
| 2015 | $5,972 | $51,310 | $13,600 | $37,710 |
| 2014 | $5,629 | $48,350 | $13,600 | $34,750 |
| 2013 | $5,560 | $50,000 | $14,060 | $35,940 |
Source: Public Records
Map
Nearby Homes
- 118 Windsor Ln
- 179 Glen Hill Dr
- 23W285 Armitage Ave
- 2N643 Diane Ave
- 1500 Golfview Ct Unit 5
- 56 N Golfview Ct
- 2N061 Bloomingdale Rd
- 108 Golfview Dr
- 1188 Harbor Ct Unit 136
- 10 W Nevada Ave
- 1148 Harbor Ct Unit 152
- 367 Mark Ave
- 203 Ahmed Ct
- 134 W Montana Ave
- 200 Ahmed Ct
- 1760 Lombard Ct
- 1160 Cedar St Unit 3A
- 251 Polo Club Dr
- 419 Sidney Ave Unit C
- 1111 Bloomingdale Rd Unit 1A
- 109 Vantroba Dr
- 101 Vantroba Dr
- 113 Vantroba Dr
- 97 Vantroba Dr
- 116 Armitage Ave
- 106 Armitage Ave
- 110 Armitage Ave
- 120 Armitage Ave
- 106 Vantroba Dr
- 100 Armitage Ave
- 100 Vantroba Dr
- 1436 Van Meter Dr
- 1424 Niess Ct
- 93 Vantroba Dr Unit 2
- 119 Vantroba Dr
- 96 Vantroba Dr
- 96 Armitage Ave
- 90 Vantroba Dr
- 87 Vantroba Dr
- 126 Armitage Ave