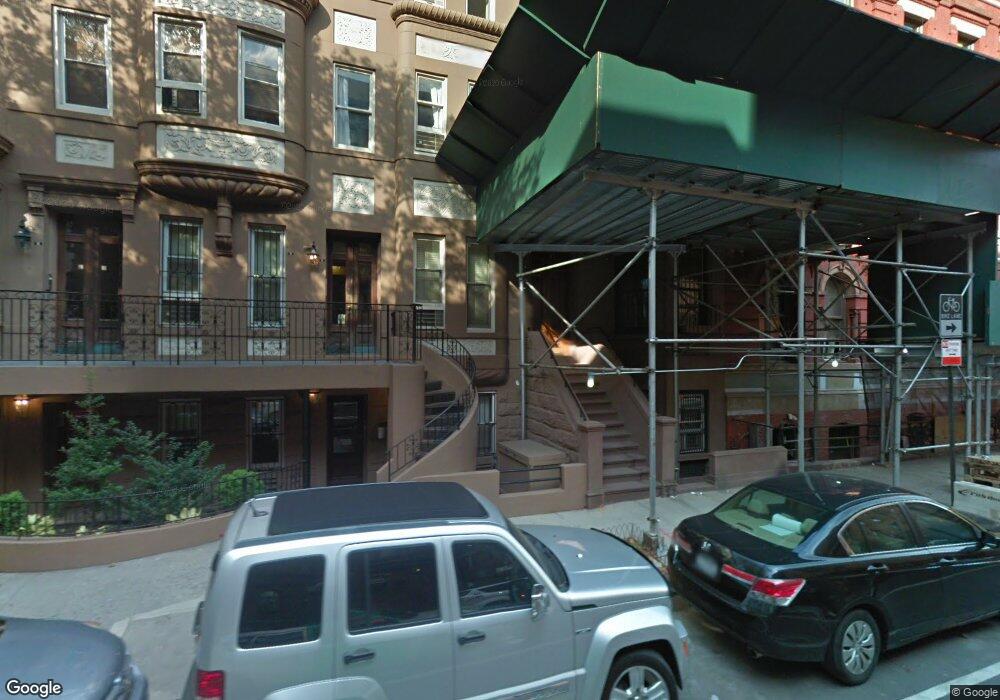
105 W 78th St Unit 4TH New York, NY 10024
Upper West Side NeighborhoodEstimated Value: $2,006,000 - $2,430,000
--
Bed
--
Bath
1,199
Sq Ft
$1,861/Sq Ft
Est. Value
About This Home
This home is located at 105 W 78th St Unit 4TH, New York, NY 10024 and is currently estimated at $2,230,989, approximately $1,860 per square foot. 105 W 78th St Unit 4TH is a home located in New York County with nearby schools including P.S. 87 William Sherman, Rodeph Sholom, and Manhattan Day School.
Ownership History
Date
Name
Owned For
Owner Type
Purchase Details
Closed on
Jun 4, 2021
Sold by
Carrington Jasmin and Carrington Toby
Bought by
Creusy Kevin and Romero Veronica
Current Estimated Value
Home Financials for this Owner
Home Financials are based on the most recent Mortgage that was taken out on this home.
Original Mortgage
$1,518,750
Outstanding Balance
$1,375,039
Interest Rate
2.9%
Mortgage Type
Purchase Money Mortgage
Estimated Equity
$855,950
Purchase Details
Closed on
Dec 29, 2016
Sold by
Jahreskog Emma and % Archer & Greiner P C Court Plaza South
Bought by
Carrington Jasmin and Carrington Toby
Home Financials for this Owner
Home Financials are based on the most recent Mortgage that was taken out on this home.
Original Mortgage
$1,596,000
Interest Rate
4.08%
Mortgage Type
Purchase Money Mortgage
Purchase Details
Closed on
Jan 14, 1998
Sold by
Litt Michael C
Bought by
Miller Richard T
Home Financials for this Owner
Home Financials are based on the most recent Mortgage that was taken out on this home.
Original Mortgage
$187,558
Interest Rate
6.87%
Create a Home Valuation Report for This Property
The Home Valuation Report is an in-depth analysis detailing your home's value as well as a comparison with similar homes in the area
Home Values in the Area
Average Home Value in this Area
Purchase History
| Date | Buyer | Sale Price | Title Company |
|---|---|---|---|
| Creusy Kevin | $2,250,000 | -- | |
| Carrington Jasmin | $1,995,000 | -- | |
| Miller Richard T | $307,000 | Titleserv |
Source: Public Records
Mortgage History
| Date | Status | Borrower | Loan Amount |
|---|---|---|---|
| Open | Creusy Kevin | $1,518,750 | |
| Previous Owner | Carrington Jasmin | $1,596,000 | |
| Previous Owner | Miller Richard T | $187,558 |
Source: Public Records
Tax History Compared to Growth
Tax History
| Year | Tax Paid | Tax Assessment Tax Assessment Total Assessment is a certain percentage of the fair market value that is determined by local assessors to be the total taxable value of land and additions on the property. | Land | Improvement |
|---|---|---|---|---|
| 2025 | $9,335 | $77,068 | $3,230 | $73,838 |
| 2024 | $9,335 | $74,671 | $12,047 | $70,753 |
| 2023 | $8,482 | $69,141 | $3,984 | $65,157 |
| 2022 | $7,833 | $231,454 | $12,047 | $219,407 |
| 2021 | $7,272 | $282,902 | $12,047 | $270,855 |
| 2020 | $4,867 | $272,953 | $12,047 | $260,906 |
| 2019 | $7,244 | $217,473 | $12,047 | $205,426 |
| 2018 | $6,765 | $53,185 | $3,742 | $49,443 |
| 2017 | $6,264 | $49,249 | $4,146 | $45,103 |
| 2016 | $5,879 | $45,602 | $4,422 | $41,180 |
| 2015 | $3,598 | $45,602 | $3,737 | $41,865 |
| 2014 | $3,598 | $44,184 | $2,745 | $41,439 |
Source: Public Records
Map
Nearby Homes
- 101 W 78th St Unit 5B
- 101 W 79th St Unit 2G
- 130 W 79th St Unit 11A
- 102 W 80th St Unit 62
- 102 W 80th St Unit 48
- 127 W 79th St Unit 10G
- 127 W 79th St Unit 6C
- 127 W 79th St Unit 15K
- 127 W 79th St Unit 9C
- 110 W 80th St Unit 4FR
- 100 W 80th St Unit 5B
- 100 W 80th St Unit 6B
- 135 W 79th St Unit 1D
- 135 W 79th St Unit 9A/10A
- 122 W 80th St Unit 3F
- 105 W 77th St Unit 3F
- 101 W 80th St Unit 7 D
- 101 W 80th St Unit 4A
- 109 W 77th St
- 145 W 79th St Unit 9D
- 105 W 78th St Unit 3RD
- 105 W 78th St Unit 2ND
- 105 W 78th St Unit 1ST
- 105 W 78th St
- 105 W 78th St Unit 3
- 105 W 78th St Unit 1
- 105 W 78th St Unit 4
- 105 W 78th St Unit 3RDFLR
- 105 W 78th St Unit A
- 103 W 78th St
- 103 W 78th St Unit 1
- 107 W 78th St
- 107 W 78th St Unit A
- 107 W 78th St Unit 4
- 107 W 78th St Unit 3
- 107 W 78th St Unit 6
- 107 W 78th St Unit 2
- 107 W 78th St Unit 1
- 109 W 78th St
- 109 W 78th St Unit B