Estimated Value: $223,731 - $244,000
--
Bed
1
Bath
1,452
Sq Ft
$161/Sq Ft
Est. Value
About This Home
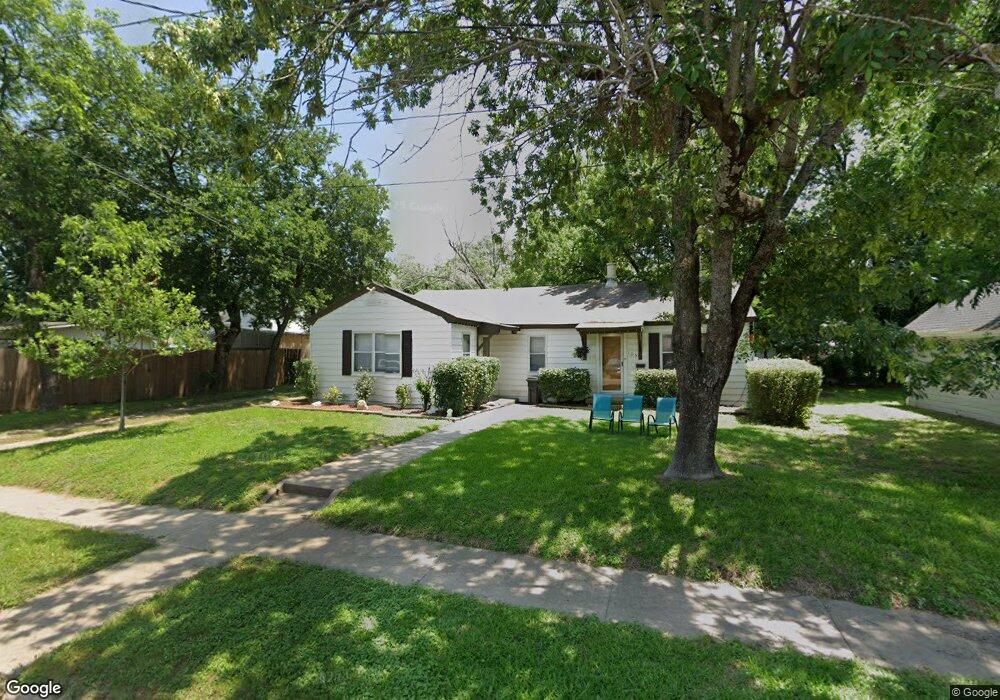
This home is located at 105 W Gilmer St, Ennis, TX 75119 and is currently estimated at $233,866, approximately $161 per square foot. 105 W Gilmer St is a home located in Ellis County with nearby schools including Jack Lummus Intermediate School, Bowie Elementary School, and Ennis Junior High School.
Ownership History
Date
Name
Owned For
Owner Type
Purchase Details
Closed on
Jan 8, 2013
Sold by
Woody Emma Dean Skroh and Woody Joseph Allen
Bought by
Skroh Bryan Daniel
Current Estimated Value
Create a Home Valuation Report for This Property
The Home Valuation Report is an in-depth analysis detailing your home's value as well as a comparison with similar homes in the area
Home Values in the Area
Average Home Value in this Area
Purchase History
| Date | Buyer | Sale Price | Title Company |
|---|---|---|---|
| Skroh Bryan Daniel | -- | None Available |
Source: Public Records
Tax History Compared to Growth
Tax History
| Year | Tax Paid | Tax Assessment Tax Assessment Total Assessment is a certain percentage of the fair market value that is determined by local assessors to be the total taxable value of land and additions on the property. | Land | Improvement |
|---|---|---|---|---|
| 2025 | $3,109 | $201,042 | $55,000 | $146,042 |
| 2024 | $3,109 | $203,021 | -- | -- |
| 2023 | $3,109 | $188,592 | $45,000 | $143,592 |
| 2022 | $4,016 | $167,786 | $27,000 | $140,786 |
| 2021 | $3,345 | $132,860 | $15,000 | $117,860 |
| 2020 | $3,344 | $129,940 | $15,000 | $114,940 |
| 2019 | $2,414 | $92,120 | $0 | $0 |
| 2018 | $1,932 | $73,190 | $9,500 | $63,690 |
| 2017 | $1,858 | $70,050 | $10,000 | $60,050 |
| 2016 | $1,837 | $69,270 | $10,000 | $59,270 |
| 2015 | $1,769 | $66,730 | $10,000 | $56,730 |
| 2014 | $1,769 | $66,780 | $0 | $0 |
Source: Public Records
Map
Nearby Homes
- 801 N Mckinney St
- 606 N Dallas St
- 607 N Dallas St
- 802 N Sherman St
- 800 N Sherman St
- 1106 N Mckinney St
- 603 N Mckinney St
- 0000 Belknap St
- 408 W Decatur St
- 206 E Belknap St
- 1206 N Kaufman St
- 811 N Gaines St
- 410 E Denton St
- 1006 E Denton St
- 301 E Denton St
- 0 E Denton St Unit 20761063
- 700 Loggins St
- 3712 Kings Dr
- 0000 E Decatur St
- 1311 Daffan Ave
- 109 W Gilmer St
- 906 N Dallas St
- 907 NW Main St
- 909 NW Main St
- 905 NW Main St
- 106 W Latimer St
- 108 W Latimer St
- 106 W Gilmer St
- 102 W Gilmer St
- 110 W Gilmer St
- 909 N Dallas St
- 1001 NW Main St
- 903 NW Main St
- 202 W Latimer St
- 200 W Gilmer St
- 1006 N Dallas St
- 205 W Gilmer St
- 1005 NW Main St
- 808 N Dallas St
- 202 W Gilmer St