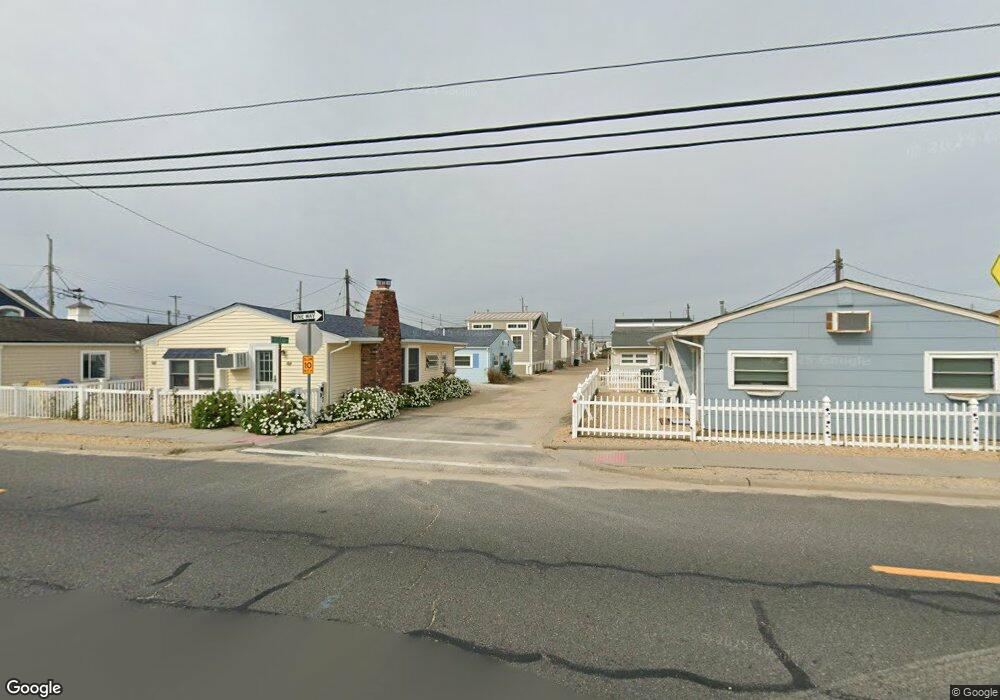
105 W Pelican Way Lavallette, NJ 08735
Dover Beaches North NeighborhoodEstimated Value: $648,000 - $731,000
2
Beds
1
Bath
560
Sq Ft
$1,219/Sq Ft
Est. Value
About This Home
This home is located at 105 W Pelican Way, Lavallette, NJ 08735 and is currently estimated at $682,683, approximately $1,219 per square foot. 105 W Pelican Way is a home located in Ocean County.
Ownership History
Date
Name
Owned For
Owner Type
Purchase Details
Closed on
Feb 19, 2024
Sold by
Golle John J and Golle Joan M
Bought by
John And Joan Golle Living Trust and Golle
Current Estimated Value
Purchase Details
Closed on
Jan 10, 2008
Sold by
Obrien Krauszer Nancy A and Obrien Nancy A
Bought by
Golle John J and Golle Joan M
Home Financials for this Owner
Home Financials are based on the most recent Mortgage that was taken out on this home.
Original Mortgage
$36,863
Interest Rate
6.02%
Mortgage Type
Stand Alone Second
Purchase Details
Closed on
Aug 28, 2003
Sold by
Neithardt Carol and Ackerman Jack
Bought by
Obrien Nancy A
Home Financials for this Owner
Home Financials are based on the most recent Mortgage that was taken out on this home.
Original Mortgage
$200,800
Interest Rate
5.56%
Mortgage Type
Purchase Money Mortgage
Create a Home Valuation Report for This Property
The Home Valuation Report is an in-depth analysis detailing your home's value as well as a comparison with similar homes in the area
Home Values in the Area
Average Home Value in this Area
Purchase History
| Date | Buyer | Sale Price | Title Company |
|---|---|---|---|
| John And Joan Golle Living Trust | -- | None Listed On Document | |
| John And Joan Golle Living Trust | -- | None Listed On Document | |
| Golle John J | $369,000 | None Available | |
| Obrien Nancy A | $251,100 | -- |
Source: Public Records
Mortgage History
| Date | Status | Borrower | Loan Amount |
|---|---|---|---|
| Previous Owner | Golle John J | $36,863 | |
| Previous Owner | Golle John J | $295,200 | |
| Previous Owner | Obrien Nancy A | $200,800 |
Source: Public Records
Tax History Compared to Growth
Tax History
| Year | Tax Paid | Tax Assessment Tax Assessment Total Assessment is a certain percentage of the fair market value that is determined by local assessors to be the total taxable value of land and additions on the property. | Land | Improvement |
|---|---|---|---|---|
| 2025 | $9,249 | $507,900 | $252,000 | $255,900 |
| 2024 | $8,792 | $507,900 | $252,000 | $255,900 |
| 2023 | $8,477 | $507,900 | $252,000 | $255,900 |
| 2022 | $8,477 | $507,900 | $252,000 | $255,900 |
| 2021 | $5,396 | $215,400 | $146,600 | $68,800 |
| 2020 | $5,372 | $215,400 | $146,600 | $68,800 |
| 2019 | $5,139 | $215,400 | $146,600 | $68,800 |
| 2018 | $5,071 | $215,400 | $146,600 | $68,800 |
| 2017 | $5,027 | $215,400 | $146,600 | $68,800 |
| 2016 | $3,332 | $146,600 | $146,600 | $0 |
| 2015 | $4,079 | $186,500 | $146,600 | $39,900 |
| 2014 | $3,883 | $186,500 | $146,600 | $39,900 |
Source: Public Records
Map
Nearby Homes
- 108 W Sandpiper Way
- 109 W Sandpiper Way
- 119 W Cormorant Way
- 114 W Plover Way
- 3311 Seaview Rd
- 348 Venice Dr
- 202 Sailfish Way Unit 3
- 3420 Seaview Rd
- 257 Strickland Blvd
- 34 S Surf Rd
- 26 N Surf Rd
- 366 Fort Meyers Ct
- 3191 Route 35 N
- 215 Harbor Dr
- 21 E Dune Way
- 316 Ormond Dr
- 201 Mallard Ln
- 124 W Chadwick Way
- 236 Gull Ln
- 417 Delray Dr
- 104 W Marlin Way
- 103 W Pelican Way
- 107 W Pelican Way
- 102 W Marlin Way
- 104 W Pelican Way
- 106 W Marlin Way
- 102 W Pelican Way
- 106 W Pelican Way
- 105 W Marlin Way
- 109 W Pelican Way
- 103 W Marlin Way
- 107 W Marlin Way
- 105 W Dolphin Way
- 101 W Pelican Way
- 108 W Marlin Way
- 100 W Marlin Way
- 103 W Dolphin Way
- 107 W Dolphin Way
- 104 W Sandpiper Way
- 108 W Pelican Way