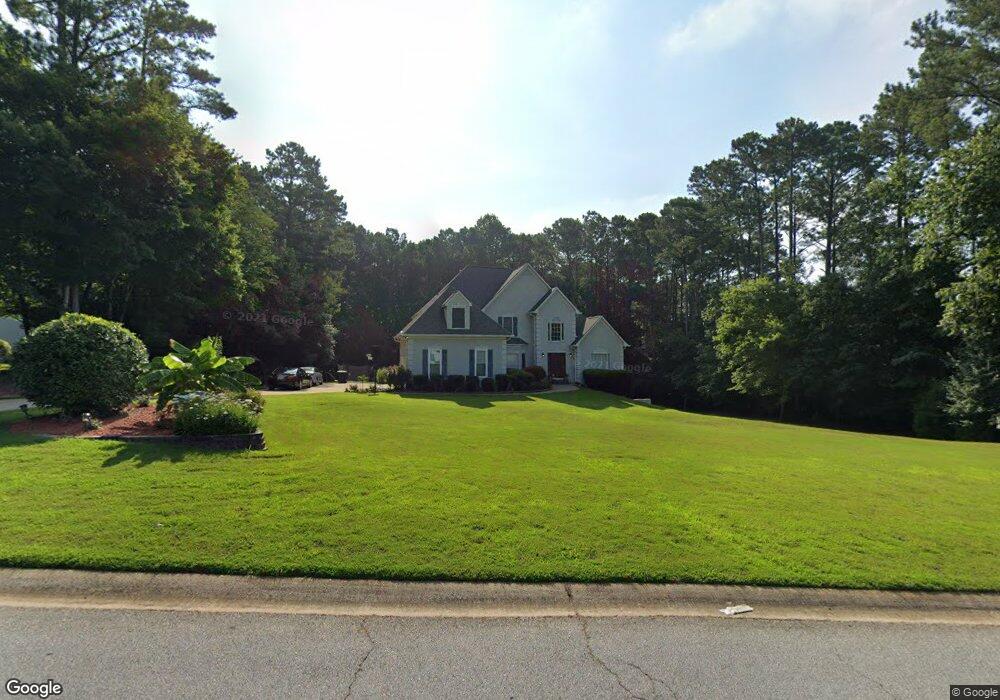
105 Yates Dr Unit 1 Fayetteville, GA 30214
Estimated Value: $405,000 - $516,903
4
Beds
4
Baths
3,338
Sq Ft
$142/Sq Ft
Est. Value
About This Home
This home is located at 105 Yates Dr Unit 1, Fayetteville, GA 30214 and is currently estimated at $472,726, approximately $141 per square foot. 105 Yates Dr Unit 1 is a home located in Fayette County with nearby schools including Cleveland Elementary School, Flat Rock Middle School, and Sandy Creek High School.
Ownership History
Date
Name
Owned For
Owner Type
Purchase Details
Closed on
Jul 22, 2016
Sold by
Walsh Thomas J and Walsh Jere D
Bought by
Hall Ken Harry and Kem Sopheak
Current Estimated Value
Home Financials for this Owner
Home Financials are based on the most recent Mortgage that was taken out on this home.
Original Mortgage
$167,250
Outstanding Balance
$133,430
Interest Rate
3.56%
Estimated Equity
$339,296
Purchase Details
Closed on
Jan 18, 2002
Sold by
Kaplan Richard
Bought by
Walsh Thomas J and Walsh Jere D
Home Financials for this Owner
Home Financials are based on the most recent Mortgage that was taken out on this home.
Original Mortgage
$180,000
Interest Rate
7.08%
Mortgage Type
New Conventional
Purchase Details
Closed on
Mar 26, 1997
Sold by
United Co Lending
Bought by
Kaplan Richard and Johnston George
Purchase Details
Closed on
Dec 3, 1996
Sold by
Walsh Thomas J Jeri D
Bought by
United Co Lending
Create a Home Valuation Report for This Property
The Home Valuation Report is an in-depth analysis detailing your home's value as well as a comparison with similar homes in the area
Home Values in the Area
Average Home Value in this Area
Purchase History
| Date | Buyer | Sale Price | Title Company |
|---|---|---|---|
| Hall Ken Harry | $223,000 | -- | |
| Walsh Thomas J | $200,000 | -- | |
| Kaplan Richard | $160,000 | -- | |
| United Co Lending | $161,000 | -- |
Source: Public Records
Mortgage History
| Date | Status | Borrower | Loan Amount |
|---|---|---|---|
| Open | Hall Ken Harry | $167,250 | |
| Previous Owner | Walsh Thomas J | $180,000 |
Source: Public Records
Tax History Compared to Growth
Tax History
| Year | Tax Paid | Tax Assessment Tax Assessment Total Assessment is a certain percentage of the fair market value that is determined by local assessors to be the total taxable value of land and additions on the property. | Land | Improvement |
|---|---|---|---|---|
| 2024 | $4,129 | $150,184 | $25,600 | $124,584 |
| 2023 | $4,069 | $144,120 | $25,600 | $118,520 |
| 2022 | $3,890 | $137,960 | $25,600 | $112,360 |
| 2021 | $3,340 | $116,560 | $14,400 | $102,160 |
| 2020 | $3,139 | $108,880 | $14,400 | $94,480 |
| 2019 | $3,021 | $103,600 | $14,400 | $89,200 |
| 2018 | $2,889 | $97,880 | $14,400 | $83,480 |
| 2017 | $2,648 | $89,200 | $13,680 | $75,520 |
| 2016 | $2,428 | $82,600 | $14,400 | $68,200 |
| 2015 | $2,456 | $82,080 | $14,400 | $67,680 |
| 2014 | $2,359 | $77,600 | $14,400 | $63,200 |
| 2013 | -- | $75,160 | $0 | $0 |
Source: Public Records
Map
Nearby Homes
- 145 Butterfield Ln
- 195 Blackberry Run
- 250 Ashley Forest Dr
- 245 Ashley Forest Dr
- 215 Ashley Forest Dr
- 100 Annelise Park Dr
- 125 Sir Lancelot Ct
- 270 Annelise Park Dr
- 1333 Sandy Creek Rd
- Palmyra Terrace homes at Trilith Plan at Town at Trilith - Town of
- 170 Rolison Way
- 551 Lees Mill Rd
- 180 Rolison Way
- 100 Bre Dr
- 215 Rolison Way
- 225 Rolison Way
- 240 Rolison Way
- 100 5th St
- 657 5th St
- 105 Yates Dr
- 115 Yates Dr
- 100 Orchard Trail
- 125 Yates Dr
- 0 Eastin Rd Unit 8578078
- 0 Eastin Rd Unit 8447167
- 0 Eastin Rd Unit 8974908
- 0 Eastin Rd Unit 8768712
- 0 Eastin Rd Unit 8780880
- 0 Eastin Rd Unit 3102105
- 0 Eastin Rd Unit 7606677
- 0 Eastin Rd Unit 7608547
- 0 Eastin Rd
- 120 Yates Dr
- 125 Lucky Leaf Place
- 364 Eastin Rd
- 115 Lucky Leaf Place Unit 7
- 115 Lucky Leaf Place
- 115 Lucky Leaf Place Unit 13
- 110 Orchard Trail