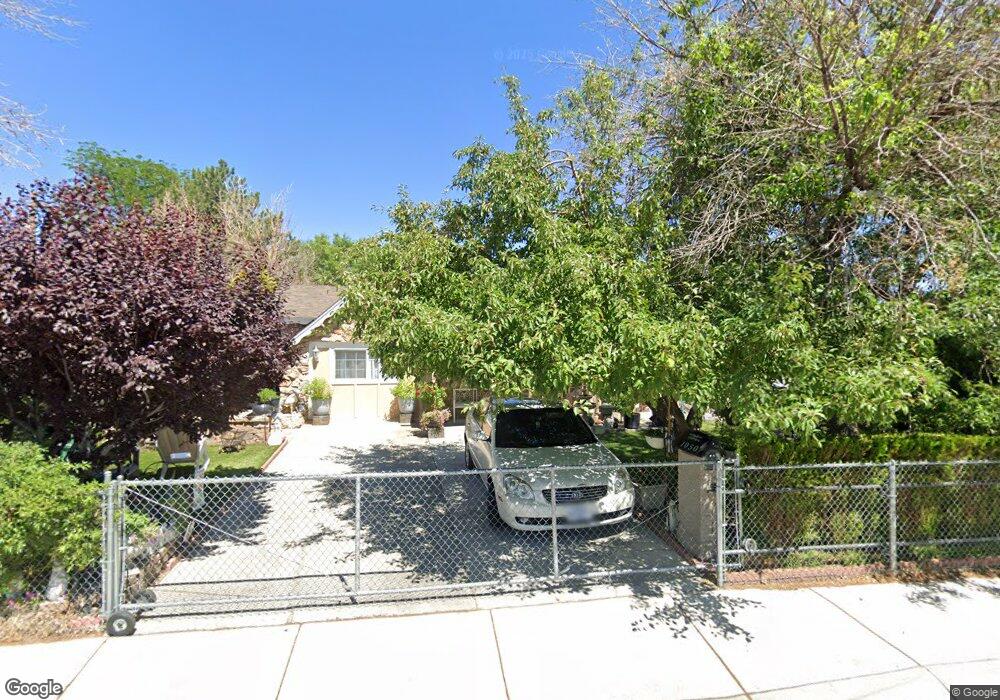
1050 Barstow St Reno, NV 89512
Northeast Reno NeighborhoodEstimated Value: $307,000 - $352,527
3
Beds
2
Baths
888
Sq Ft
$373/Sq Ft
Est. Value
About This Home
This home is located at 1050 Barstow St, Reno, NV 89512 and is currently estimated at $331,132, approximately $372 per square foot. 1050 Barstow St is a home located in Washoe County with nearby schools including Glenn Duncan STEM Academy, Fred W. Traner Middle School, and Procter R. Hug High School.
Ownership History
Date
Name
Owned For
Owner Type
Purchase Details
Closed on
Jul 17, 2002
Sold by
Lowery Susan B and Lowery Phillip G
Bought by
Martinez Fernando and Martinez Imelda S
Current Estimated Value
Home Financials for this Owner
Home Financials are based on the most recent Mortgage that was taken out on this home.
Original Mortgage
$101,850
Outstanding Balance
$43,146
Interest Rate
6.7%
Estimated Equity
$287,986
Purchase Details
Closed on
Oct 6, 1998
Sold by
Buddine Lowery Susan B and Buddine Dendy Susan
Bought by
Lowery Phillip G and Lowery Susan B
Home Financials for this Owner
Home Financials are based on the most recent Mortgage that was taken out on this home.
Original Mortgage
$10,500
Interest Rate
6.88%
Purchase Details
Closed on
Jan 13, 1995
Sold by
Vanornum Glenn Z
Bought by
Buddine Dendy Susan Buddine and Buddine Vanornum Susan
Create a Home Valuation Report for This Property
The Home Valuation Report is an in-depth analysis detailing your home's value as well as a comparison with similar homes in the area
Home Values in the Area
Average Home Value in this Area
Purchase History
| Date | Buyer | Sale Price | Title Company |
|---|---|---|---|
| Martinez Fernando | $105,000 | First Centennial Title Co | |
| Lowery Phillip G | -- | Western Title Company Inc | |
| Buddine Dendy Susan Buddine | -- | -- |
Source: Public Records
Mortgage History
| Date | Status | Borrower | Loan Amount |
|---|---|---|---|
| Open | Martinez Fernando | $101,850 | |
| Previous Owner | Lowery Phillip G | $10,500 |
Source: Public Records
Tax History Compared to Growth
Tax History
| Year | Tax Paid | Tax Assessment Tax Assessment Total Assessment is a certain percentage of the fair market value that is determined by local assessors to be the total taxable value of land and additions on the property. | Land | Improvement |
|---|---|---|---|---|
| 2025 | $560 | $42,847 | $28,490 | $14,357 |
| 2024 | $560 | $39,387 | $25,235 | $14,152 |
| 2023 | $532 | $40,452 | $27,685 | $12,767 |
| 2022 | $517 | $32,303 | $21,910 | $10,393 |
| 2021 | $503 | $24,992 | $14,945 | $10,047 |
| 2020 | $486 | $24,088 | $14,140 | $9,948 |
| 2019 | $473 | $23,570 | $14,105 | $9,465 |
| 2018 | $459 | $18,210 | $9,135 | $9,075 |
| 2017 | $447 | $17,003 | $7,910 | $9,093 |
| 2016 | $436 | $16,144 | $7,070 | $9,074 |
| 2015 | $435 | $13,817 | $4,865 | $8,952 |
| 2014 | $422 | $12,466 | $3,990 | $8,476 |
| 2013 | -- | $10,044 | $2,765 | $7,279 |
Source: Public Records
Map
Nearby Homes
- 1775 Carville Dr
- 920 Montello St
- 1885 Castle Way
- 1525 Carville Dr
- 1414 E 9th St Unit 4
- 1347 Butler St
- 1365 E 11th St
- 1424 E 9th St Unit 2
- 1412 E 9th St Unit 7
- 1990 Trainer Way
- 1281 E 10th St
- 1195 Silverada Blvd
- 168 Poppy Ln
- 204 Poppy Ln
- 135 Carnation Ln
- 112 Lilac Ln
- 113 Lilac Ln
- 1855 Mccloud Ave
- 1680 Sutro St
- 1868 Fife Dr
- 1000 Barstow St
- 1070 Barstow St
- 1055 Goldfield St
- 1075 Goldfield St
- 1895 E 10th St
- 1895 E 10th St Unit NV
- 1090 Barstow St
- 1090 Barstow St Unit A
- 1095 Goldfield St
- 1110 Barstow St
- 1105 Goldfield St Unit A2U
- 1060 Goldfield St
- 1070 Goldfield St
- 1000 Goldfield St
- 1130 Barstow St
- 1135 Goldfield St
- 1100 Goldfield St
- 1110 Goldfield St
- 1150 Barstow St
- 1155 Goldfield St Unit 1