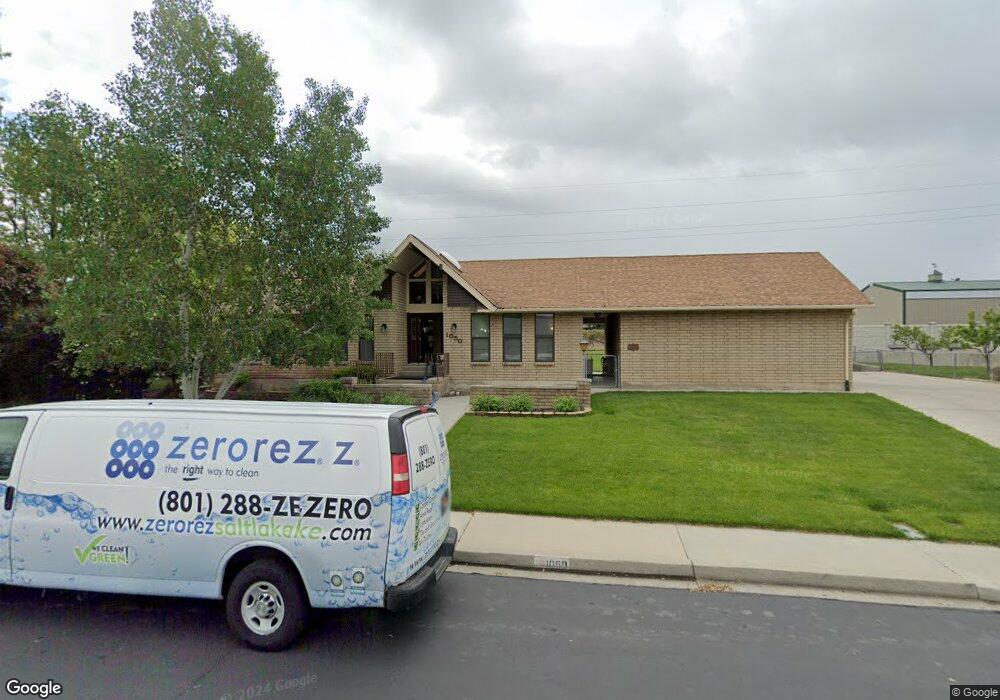
1050 E 1000 S Spanish Fork, UT 84660
Estimated Value: $702,000 - $767,634
4
Beds
4
Baths
4,500
Sq Ft
$162/Sq Ft
Est. Value
About This Home
This home is located at 1050 E 1000 S, Spanish Fork, UT 84660 and is currently estimated at $727,878, approximately $161 per square foot. 1050 E 1000 S is a home located in Utah County with nearby schools including Canyon Elementary School, Spanish Fork Jr High School, and Spanish Fork High School.
Ownership History
Date
Name
Owned For
Owner Type
Purchase Details
Closed on
Sep 6, 2022
Sold by
Black Benjamin W
Bought by
Benjamin And Susan Black Family Trust
Current Estimated Value
Purchase Details
Closed on
Jan 29, 2002
Sold by
Newman John A and Newman Betty J
Bought by
Black Benjamin W and Black Susan M
Home Financials for this Owner
Home Financials are based on the most recent Mortgage that was taken out on this home.
Original Mortgage
$203,900
Interest Rate
7.17%
Purchase Details
Closed on
Oct 4, 2000
Sold by
Llewellyn Robert W and Llewellyn Carol
Bought by
Llewellyn Carol H and Llewellyn Robert W
Purchase Details
Closed on
May 6, 1997
Sold by
Lewis Neal C
Bought by
Newman John A and Newman Betty J
Home Financials for this Owner
Home Financials are based on the most recent Mortgage that was taken out on this home.
Original Mortgage
$46,492
Interest Rate
7.98%
Create a Home Valuation Report for This Property
The Home Valuation Report is an in-depth analysis detailing your home's value as well as a comparison with similar homes in the area
Home Values in the Area
Average Home Value in this Area
Purchase History
| Date | Buyer | Sale Price | Title Company |
|---|---|---|---|
| Benjamin And Susan Black Family Trust | -- | -- | |
| Black Benjamin W | -- | Guardian Title Ins Agency | |
| Llewellyn Carol H | -- | Pro Title & Escrow Inc | |
| Newman John A | -- | -- |
Source: Public Records
Mortgage History
| Date | Status | Borrower | Loan Amount |
|---|---|---|---|
| Previous Owner | Black Benjamin W | $203,900 | |
| Previous Owner | Newman John A | $46,492 |
Source: Public Records
Tax History
| Year | Tax Paid | Tax Assessment Tax Assessment Total Assessment is a certain percentage of the fair market value that is determined by local assessors to be the total taxable value of land and additions on the property. | Land | Improvement |
|---|---|---|---|---|
| 2025 | $3,357 | $399,080 | -- | -- |
| 2024 | $3,310 | $346,005 | $0 | $0 |
| 2023 | $3,310 | $341,605 | $0 | $0 |
| 2022 | $3,166 | $320,375 | $0 | $0 |
| 2021 | $2,749 | $445,100 | $129,000 | $316,100 |
| 2020 | $2,555 | $402,100 | $117,300 | $284,800 |
| 2019 | $2,299 | $380,700 | $110,700 | $270,000 |
| 2018 | $2,202 | $352,500 | $102,500 | $250,000 |
| 2017 | $2,148 | $184,855 | $0 | $0 |
| 2016 | $1,929 | $163,790 | $0 | $0 |
| 2015 | $1,952 | $163,790 | $0 | $0 |
| 2014 | $1,945 | $163,790 | $0 | $0 |
Source: Public Records
Map
Nearby Homes
- 834 S 1300 #16gc E
- 816 S 1300 #15gc E
- 857 S 1300 E Unit 32
- 857 S 1300 E
- 1105 S 200 E
- 815 S 1300 E Unit 34
- 789 S 1300 E
- 762 S 1360 E
- 762 S 1360 E Unit 25
- 232 E 860 S Unit 158
- 715 Scenic Dr
- 2256 E 760 S Unit 7
- 2308 E 850 South St Unit 10
- 993 S 1660 E
- 1147 S 1660 E
- 1687 E 1000 S
- 2998 Canyon Dr Unit 333
- 3014 Canyon Dr Unit 332
- 1330 E 410 S
- 938 S 1740 E
Your Personal Tour Guide
Ask me questions while you tour the home.