Estimated Value: $67,089 - $104,000
3
Beds
--
Bath
1,492
Sq Ft
$60/Sq Ft
Est. Value
About This Home
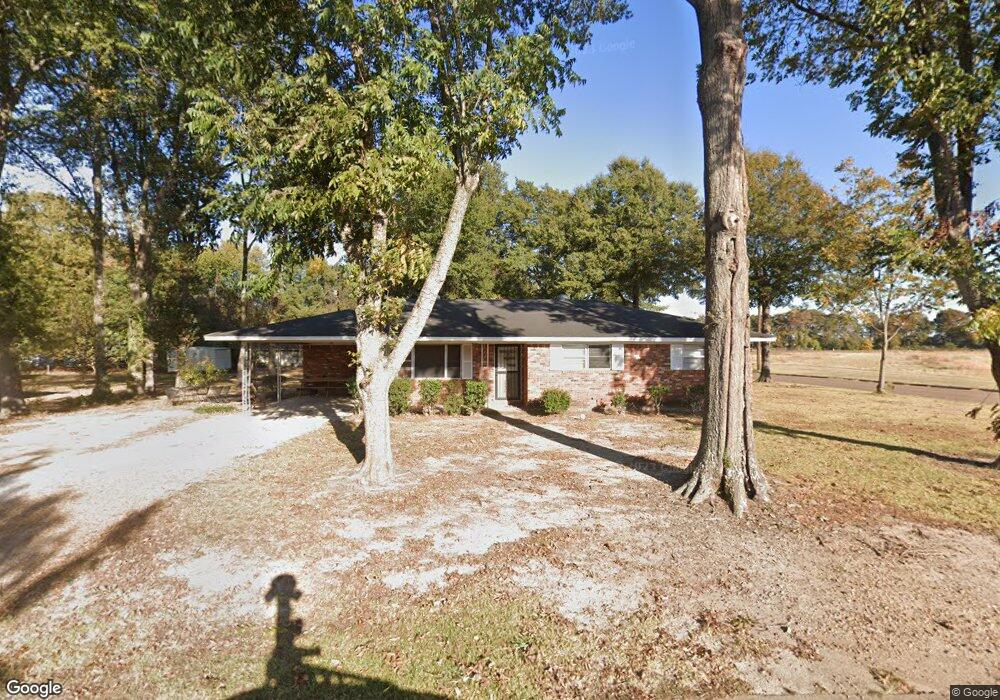
This home is located at 1050 Myrtle St, Marks, MS 38646 and is currently estimated at $89,522, approximately $60 per square foot. 1050 Myrtle St is a home with nearby schools including Quitman County Elementary School, Quitman County Middle School, and M.S. Palmer High School.
Ownership History
Date
Name
Owned For
Owner Type
Purchase Details
Closed on
Jan 23, 2018
Bought by
Scipper Thomas Layton
Current Estimated Value
Purchase Details
Closed on
Oct 21, 2011
Sold by
Collins David G and Malatesta Terry C
Bought by
Collins Billy D
Purchase Details
Closed on
Jun 5, 2009
Sold by
Collins Lillie Mae G
Bought by
Collins David G and Malatesta Terry C
Purchase Details
Closed on
Oct 27, 2008
Sold by
Collins David D and Collins Lillie Mae G
Bought by
Collins Lillie Mae G
Purchase Details
Closed on
Feb 24, 2006
Sold by
Collins David D and Collins Lillie Mae
Bought by
Collins David G and Collins Terry C
Create a Home Valuation Report for This Property
The Home Valuation Report is an in-depth analysis detailing your home's value as well as a comparison with similar homes in the area
Purchase History
| Date | Buyer | Sale Price | Title Company |
|---|---|---|---|
| Scipper Thomas Layton | -- | -- | |
| Collins Billy D | -- | -- | |
| Collins David G | -- | -- | |
| Collins Lillie Mae G | -- | -- | |
| Collins David G | -- | -- |
Source: Public Records
Tax History
| Year | Tax Paid | Tax Assessment Tax Assessment Total Assessment is a certain percentage of the fair market value that is determined by local assessors to be the total taxable value of land and additions on the property. | Land | Improvement |
|---|---|---|---|---|
| 2025 | $2,156 | $8,791 | $1,200 | $7,591 |
| 2024 | $2,170 | $8,791 | $1,200 | $7,591 |
| 2023 | $2,106 | $8,791 | $1,200 | $7,591 |
| 2022 | $1,659 | $7,109 | $1,200 | $5,909 |
| 2021 | $1,554 | $7,109 | $1,200 | $5,909 |
| 2020 | $1,517 | $7,109 | $1,200 | $5,909 |
| 2019 | $1,508 | $7,109 | $1,200 | $5,909 |
| 2018 | $1,327 | $6,322 | $1,200 | $5,122 |
| 2017 | $1,268 | $6,322 | $1,200 | $5,122 |
| 2016 | $1,268 | $6,322 | $1,200 | $5,122 |
| 2015 | -- | $6,322 | $1,200 | $5,122 |
| 2014 | -- | $6,346 | $1,200 | $5,146 |
| 2013 | -- | $6,346 | $1,200 | $5,146 |
Source: Public Records
Map
Nearby Homes
- 0 Covington Rd
- 0 Howard St
- 0 US Highway 278
- tbd Mississippi 6
- 0 Jossell Rd
- Hwy 278
- Highway 6
- 0 Airport Rd
- 502 10th St
- 10600 Highway 3
- 1211 Scott Ave
- 00 Hood Rd
- 0 Eason Rd
- 0 278 Unit 2019001111
- 1019 Jamison Rd
- 2264 Jamison Rd
- 7245 Hood Rd
- 380 Locke Station Rd
- Dummyline Rd Unit LotWP001
- 0 Curtis Rd Unit 4105556
Your Personal Tour Guide
Ask me questions while you tour the home.