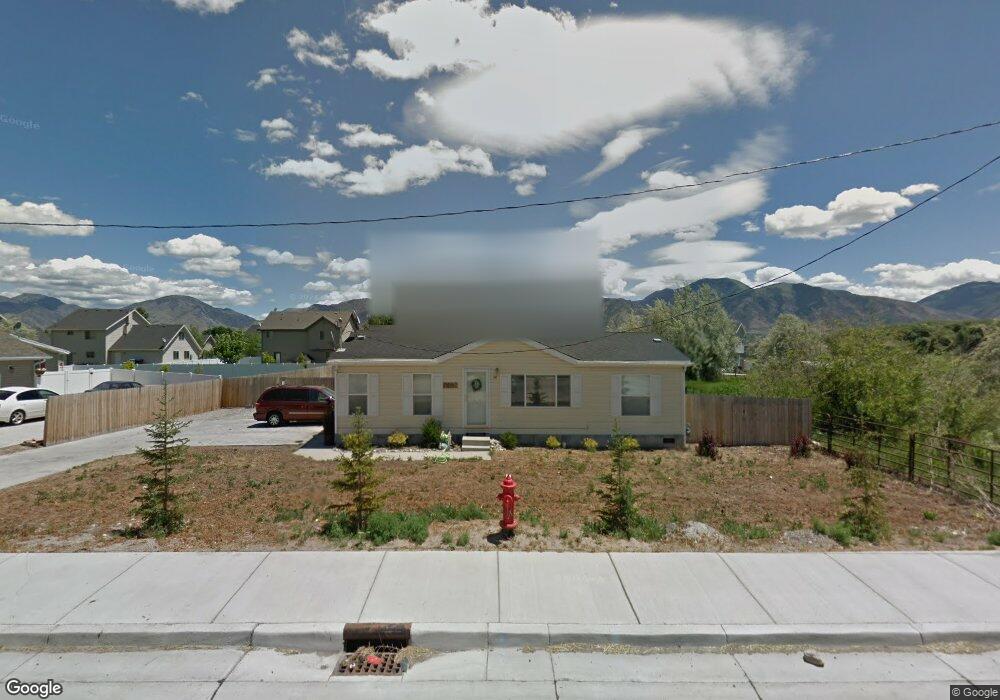
1050 S 1000 W Unit 3 Logan, UT 84321
Woodruff NeighborhoodEstimated Value: $317,000 - $352,311
--
Bed
--
Bath
1,188
Sq Ft
$282/Sq Ft
Est. Value
About This Home
This home is located at 1050 S 1000 W Unit 3, Logan, UT 84321 and is currently estimated at $335,328, approximately $282 per square foot. 1050 S 1000 W Unit 3 is a home located in Cache County with nearby schools including Woodruff School, Mount Logan Middle School, and Logan High School.
Ownership History
Date
Name
Owned For
Owner Type
Purchase Details
Closed on
Sep 10, 2025
Sold by
Hachmeister Andrew
Bought by
Hachmeister Andrew and Hachmeister Tpring
Current Estimated Value
Purchase Details
Closed on
Jun 27, 2024
Sold by
Ben Gochberg And Duh2 Llc
Bought by
Hachmeister Andrew
Home Financials for this Owner
Home Financials are based on the most recent Mortgage that was taken out on this home.
Original Mortgage
$296,530
Interest Rate
7.02%
Mortgage Type
FHA
Purchase Details
Closed on
Mar 17, 2023
Sold by
Rodemack Kyle
Bought by
Ben Gochberg And Duh2 Llc
Home Financials for this Owner
Home Financials are based on the most recent Mortgage that was taken out on this home.
Original Mortgage
$90,000
Interest Rate
6.09%
Mortgage Type
New Conventional
Purchase Details
Closed on
Mar 11, 2009
Sold by
Duersch Keegan R and Duersch Kelli A
Bought by
Rodemack Kyle and Rodemack Melissa
Home Financials for this Owner
Home Financials are based on the most recent Mortgage that was taken out on this home.
Original Mortgage
$103,833
Interest Rate
5.03%
Mortgage Type
FHA
Create a Home Valuation Report for This Property
The Home Valuation Report is an in-depth analysis detailing your home's value as well as a comparison with similar homes in the area
Home Values in the Area
Average Home Value in this Area
Purchase History
| Date | Buyer | Sale Price | Title Company |
|---|---|---|---|
| Hachmeister Andrew | -- | Cache Title | |
| Hachmeister Andrew | -- | Advanced Title | |
| Ben Gochberg And Duh2 Llc | -- | Hickman Land Title | |
| Ben Gochberg And Duh2 Llc | -- | Hickman Land Title | |
| Rodemack Kyle | -- | American Secure Title |
Source: Public Records
Mortgage History
| Date | Status | Borrower | Loan Amount |
|---|---|---|---|
| Previous Owner | Hachmeister Andrew | $296,530 | |
| Previous Owner | Ben Gochberg And Duh2 Llc | $90,000 | |
| Previous Owner | Rodemack Kyle | $103,833 |
Source: Public Records
Tax History Compared to Growth
Tax History
| Year | Tax Paid | Tax Assessment Tax Assessment Total Assessment is a certain percentage of the fair market value that is determined by local assessors to be the total taxable value of land and additions on the property. | Land | Improvement |
|---|---|---|---|---|
| 2025 | $1,148 | $148,420 | $0 | $0 |
| 2024 | $1,092 | $136,785 | $0 | $0 |
| 2023 | $114 | $136,585 | $0 | $0 |
| 2022 | $932 | $103,860 | $0 | $0 |
| 2021 | $936 | $161,170 | $50,500 | $110,670 |
| 2020 | $843 | $130,701 | $50,500 | $80,201 |
| 2019 | $881 | $130,701 | $50,500 | $80,201 |
| 2018 | $888 | $120,240 | $50,500 | $69,740 |
| 2017 | $794 | $56,870 | $0 | $0 |
| 2016 | $823 | $56,870 | $0 | $0 |
| 2015 | $801 | $55,230 | $0 | $0 |
| 2014 | $724 | $55,230 | $0 | $0 |
| 2013 | -- | $55,230 | $0 | $0 |
Source: Public Records
Map
Nearby Homes
- 1206 S 900 W
- 736 Majestic Dr
- 985 W 720 S
- 420 S 1400 W
- 1220 W 575 S
- 553 Center Ave
- 548 S 1225 W Unit 115
- 1645 S 1380 W
- 542 S 1225 W Unit 116
- 1239 W 575 S Unit 152
- 1239 W 575 S
- 518 S 1225 W
- 501 Southwest St
- 506 S 1225 W
- Hemlock Plan at Sugar Creek - Logan
- Eucalyptus Plan at Sugar Creek - Logan
- Blackberry Plan at Sugar Creek - Logan
- Magnolia Plan at Sugar Creek - Logan
- 763 S 1500 W
- 1227 W 500 S Unit 151
- 1050 S 1000 W Unit 2
- 1050 S 1000 W Unit 1
- 1050 S 1000 W Unit 4
- 1092 S 1000 W
- 1080 S 1000 W
- 1085 Southgate Ct
- 1122 S 1000 W
- 1093 Southgate Ct
- 1079 Southgate Ct
- 1062 S 1000 W
- 1061 Southgate Ct
- 1097 Southgate Ct
- 975 Dahle Way
- 1048 S 1000 W
- 1047 Southgate Ct
- 1088 Southgate Ct
- 1080 Southgate Ct
- 965 Dahle Way
- 1151 S 1000 W
- 1062 Southgate Ct