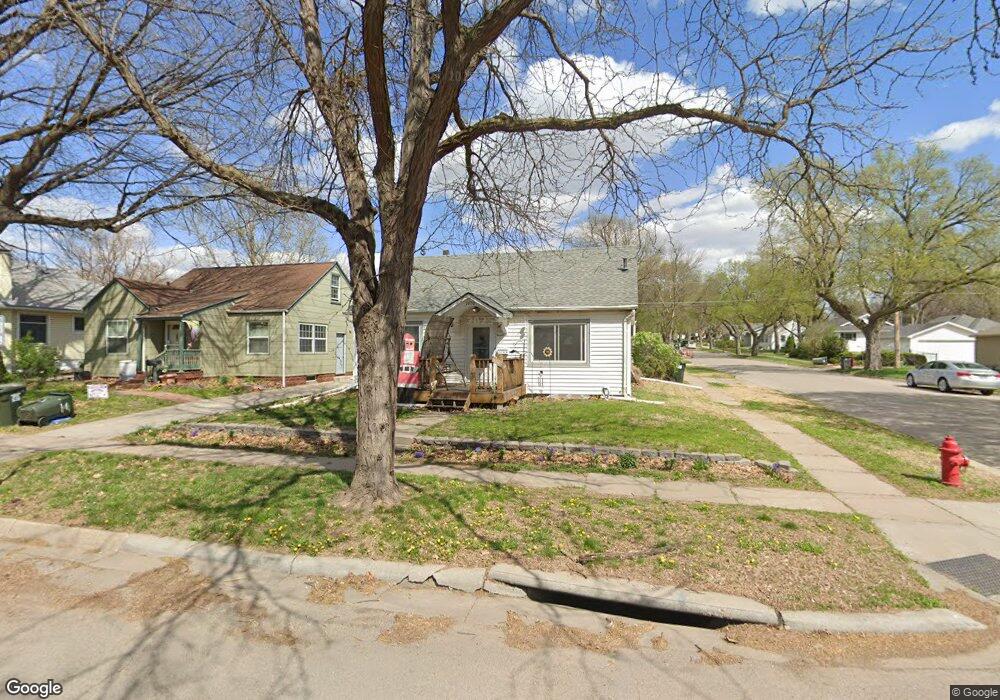
1050 S 31st St Lincoln, NE 68510
Woods Park NeighborhoodEstimated Value: $202,965 - $219,000
2
Beds
1
Bath
1,037
Sq Ft
$200/Sq Ft
Est. Value
About This Home
This home is located at 1050 S 31st St, Lincoln, NE 68510 and is currently estimated at $207,741, approximately $200 per square foot. 1050 S 31st St is a home located in Lancaster County with nearby schools including Randolph Elementary School, Lefler Middle School, and Lincoln High School.
Ownership History
Date
Name
Owned For
Owner Type
Purchase Details
Closed on
Feb 22, 2016
Sold by
May Kurt Alan
Bought by
May Ami R
Current Estimated Value
Purchase Details
Closed on
Jan 21, 2000
Sold by
Wright Judy K and Wright Edward A
Bought by
May Kurt Alan and May Ami R
Home Financials for this Owner
Home Financials are based on the most recent Mortgage that was taken out on this home.
Original Mortgage
$81,600
Outstanding Balance
$25,965
Interest Rate
7.86%
Mortgage Type
VA
Estimated Equity
$181,776
Create a Home Valuation Report for This Property
The Home Valuation Report is an in-depth analysis detailing your home's value as well as a comparison with similar homes in the area
Home Values in the Area
Average Home Value in this Area
Purchase History
| Date | Buyer | Sale Price | Title Company |
|---|---|---|---|
| May Ami R | -- | None Available | |
| May Kurt Alan | $80,000 | -- |
Source: Public Records
Mortgage History
| Date | Status | Borrower | Loan Amount |
|---|---|---|---|
| Open | May Kurt Alan | $81,600 |
Source: Public Records
Tax History Compared to Growth
Tax History
| Year | Tax Paid | Tax Assessment Tax Assessment Total Assessment is a certain percentage of the fair market value that is determined by local assessors to be the total taxable value of land and additions on the property. | Land | Improvement |
|---|---|---|---|---|
| 2025 | $2,344 | $188,900 | $46,000 | $142,900 |
| 2024 | $2,344 | $169,600 | $40,000 | $129,600 |
| 2023 | $2,843 | $169,600 | $40,000 | $129,600 |
| 2022 | $2,806 | $140,800 | $35,000 | $105,800 |
| 2021 | $2,655 | $140,800 | $35,000 | $105,800 |
| 2020 | $2,247 | $117,600 | $35,000 | $82,600 |
| 2019 | $2,247 | $117,600 | $35,000 | $82,600 |
| 2018 | $2,276 | $118,600 | $35,000 | $83,600 |
| 2017 | $2,297 | $118,600 | $35,000 | $83,600 |
| 2016 | $2,161 | $111,000 | $35,000 | $76,000 |
| 2015 | $2,147 | $111,000 | $35,000 | $76,000 |
| 2014 | $2,019 | $103,800 | $29,800 | $74,000 |
| 2013 | -- | $103,800 | $29,800 | $74,000 |
Source: Public Records
Map
Nearby Homes