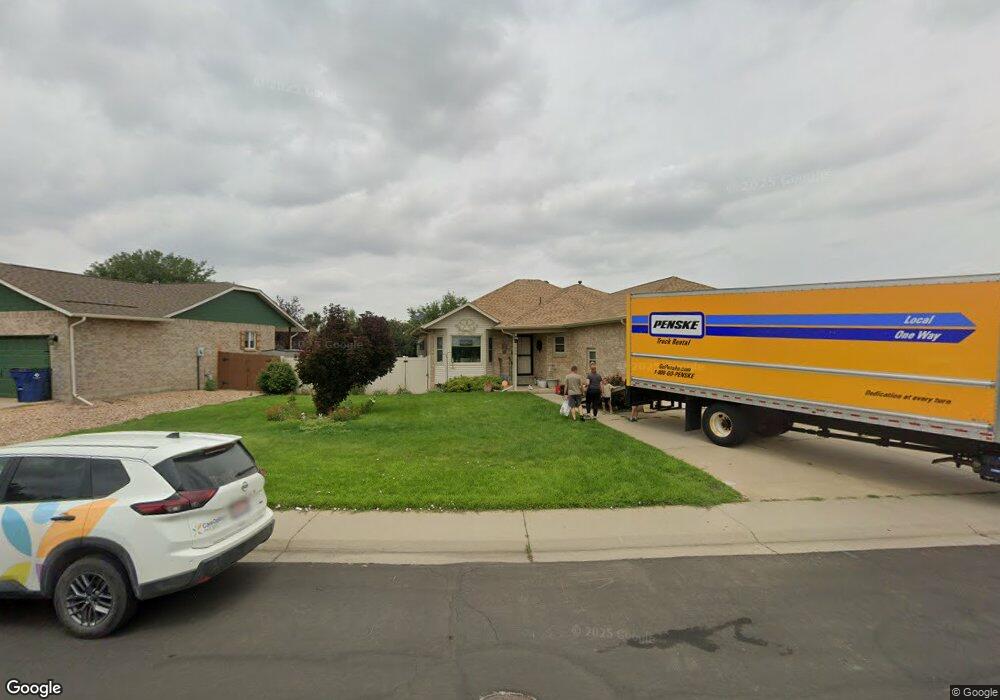
1050 S Fulton Ave Fort Lupton, CO 80621
Estimated Value: $496,450 - $551,000
4
Beds
6
Baths
1,731
Sq Ft
$303/Sq Ft
Est. Value
About This Home
This home is located at 1050 S Fulton Ave, Fort Lupton, CO 80621 and is currently estimated at $524,613, approximately $303 per square foot. 1050 S Fulton Ave is a home located in Weld County with nearby schools including Leo William Butler Elementary School, Fort Lupton Middle School, and Fort Lupton High School.
Ownership History
Date
Name
Owned For
Owner Type
Purchase Details
Closed on
May 20, 1997
Sold by
Pineau Gerald A and Pineau Jerri A
Bought by
Brewer William R and Brewer Mary Jean
Current Estimated Value
Home Financials for this Owner
Home Financials are based on the most recent Mortgage that was taken out on this home.
Original Mortgage
$89,500
Outstanding Balance
$12,386
Interest Rate
8.12%
Estimated Equity
$512,227
Purchase Details
Closed on
Aug 8, 1994
Sold by
Rushing Construction Inc
Bought by
Pineau Gerald A and Pineau Jerri A
Purchase Details
Closed on
Nov 19, 1993
Sold by
Heartso John F and Heartso Shirley M
Bought by
Rushing Construction Inc
Purchase Details
Closed on
Jul 17, 1992
Sold by
Wethington William J and Wethington Elizabe
Bought by
Heartso John F and Heartso Shirley M
Purchase Details
Closed on
Dec 23, 1986
Create a Home Valuation Report for This Property
The Home Valuation Report is an in-depth analysis detailing your home's value as well as a comparison with similar homes in the area
Home Values in the Area
Average Home Value in this Area
Purchase History
| Date | Buyer | Sale Price | Title Company |
|---|---|---|---|
| Brewer William R | $158,500 | Land Title | |
| Pineau Gerald A | $152,400 | -- | |
| Rushing Construction Inc | $112,000 | -- | |
| Heartso John F | $115,000 | -- | |
| -- | -- | -- |
Source: Public Records
Mortgage History
| Date | Status | Borrower | Loan Amount |
|---|---|---|---|
| Open | Brewer William R | $89,500 |
Source: Public Records
Tax History Compared to Growth
Tax History
| Year | Tax Paid | Tax Assessment Tax Assessment Total Assessment is a certain percentage of the fair market value that is determined by local assessors to be the total taxable value of land and additions on the property. | Land | Improvement |
|---|---|---|---|---|
| 2025 | $2,462 | $29,080 | $5,630 | $23,450 |
| 2024 | $2,462 | $29,080 | $5,630 | $23,450 |
| 2023 | $2,180 | $35,530 | $6,090 | $29,440 |
| 2022 | $1,643 | $24,630 | $3,480 | $21,150 |
| 2021 | $1,890 | $25,340 | $3,580 | $21,760 |
| 2020 | $1,591 | $24,330 | $3,220 | $21,110 |
| 2019 | $1,588 | $24,330 | $3,220 | $21,110 |
| 2018 | $1,288 | $20,980 | $2,520 | $18,460 |
| 2017 | $1,331 | $20,980 | $2,520 | $18,460 |
| 2016 | $1,218 | $21,210 | $2,390 | $18,820 |
| 2015 | $1,111 | $21,210 | $2,390 | $18,820 |
| 2014 | $680 | $7,590 | $1,390 | $6,200 |
Source: Public Records
Map
Nearby Homes
- 1030 S Fulton Ave
- 820 S Denver Ave
- 735 S Hoover Ave
- 0 S Denver Ave Unit REC2837562
- 702 S Fulton Ave
- 669 S Hoover Ave
- 624 S Cabernet Ave
- 608 S Cabernet Ave
- 604 S Cabernet Ave
- 500 S Denver Ave Unit 7B
- 260 W Hill Ct
- 503 S Rollie Ave Unit 13C
- 503 S Rollie Ave Unit 10A
- 503 S Rollie Ave Unit 7A
- 330 S Mckinley Ave
- 529 Beckwourth Ave
- 359 Josef Cir
- 367 Josef Cir
- 371 Josef Cir
- 210 S Grand Ave
- 960 S Mckinley Ave
- 1035 S Fulton Ave
- 1020 S Fulton Ave
- 965 S Mckinley Ave
- 950 S Mckinley Ave
- 1025 S Fulton Ave
- 1010 S Fulton Ave
- 955 S Mckinley Ave
- 940 S Mckinley Ave
- 945 S Mckinley Ave
- 970 S Hoover Ave
- 1000 S Fulton Ave
- 930 S Mckinley Ave
- 960 S Hoover Ave
- 935 S Mckinley Ave
- 975 S Hoover Ave
- 1005 S Fulton Ave
- 990 S Fulton Ave
- 950 S Hoover Ave
- 920 S Mckinley Ave