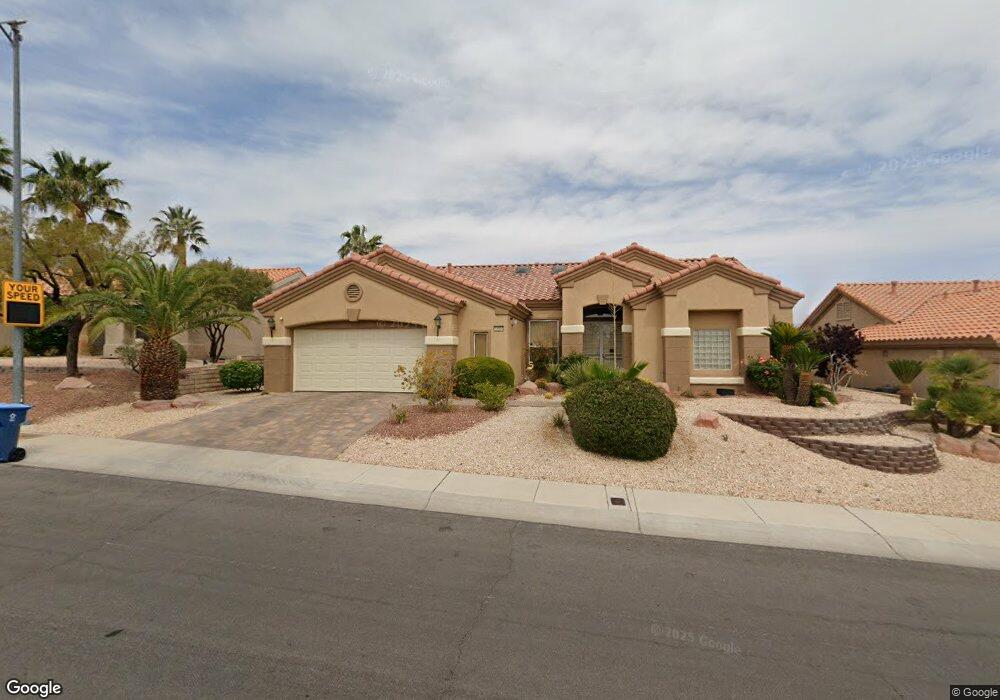
10500 Button Willow Dr Unit 42 Las Vegas, NV 89134
Sun City Summerlin NeighborhoodEstimated Value: $685,129 - $859,000
3
Beds
2
Baths
2,176
Sq Ft
$357/Sq Ft
Est. Value
About This Home
This home is located at 10500 Button Willow Dr Unit 42, Las Vegas, NV 89134 and is currently estimated at $776,282, approximately $356 per square foot. 10500 Button Willow Dr Unit 42 is a home located in Clark County with nearby schools including William Lummis Elementary School, Ernest Becker Middle School, and Palo Verde High School.
Ownership History
Date
Name
Owned For
Owner Type
Purchase Details
Closed on
Jan 16, 2006
Sold by
Osinski Paul and Osinski Gail
Bought by
Osinski Paul and Osinski Gail
Current Estimated Value
Purchase Details
Closed on
Oct 8, 2004
Sold by
Calderon Sol E and Calderon Barbara J
Bought by
Osinski Paul and Osinski Gail
Home Financials for this Owner
Home Financials are based on the most recent Mortgage that was taken out on this home.
Original Mortgage
$382,500
Outstanding Balance
$142,347
Interest Rate
2.12%
Mortgage Type
Negative Amortization
Estimated Equity
$633,935
Purchase Details
Closed on
Feb 24, 2000
Sold by
Fein Rita
Bought by
Calderon Sol E and Calderon Barbara J
Purchase Details
Closed on
Apr 10, 1998
Sold by
Del Webb Communities Inc
Bought by
Fein Rita and The Rita Fein Revocable Living Trust
Create a Home Valuation Report for This Property
The Home Valuation Report is an in-depth analysis detailing your home's value as well as a comparison with similar homes in the area
Home Values in the Area
Average Home Value in this Area
Purchase History
| Date | Buyer | Sale Price | Title Company |
|---|---|---|---|
| Osinski Paul | -- | None Available | |
| Osinski Paul | $510,000 | Ticor Title Of Nevada Inc | |
| Calderon Sol E | $400,000 | Old Republic Title Company | |
| Fein Rita | $306,000 | First American Title Co |
Source: Public Records
Mortgage History
| Date | Status | Borrower | Loan Amount |
|---|---|---|---|
| Open | Osinski Paul | $382,500 |
Source: Public Records
Tax History Compared to Growth
Tax History
| Year | Tax Paid | Tax Assessment Tax Assessment Total Assessment is a certain percentage of the fair market value that is determined by local assessors to be the total taxable value of land and additions on the property. | Land | Improvement |
|---|---|---|---|---|
| 2025 | $3,946 | $148,603 | $63,700 | $84,903 |
| 2024 | $3,831 | $148,603 | $63,700 | $84,903 |
| 2023 | $3,831 | $140,047 | $59,500 | $80,547 |
| 2022 | $3,720 | $126,410 | $52,500 | $73,910 |
| 2021 | $3,611 | $116,502 | $46,200 | $70,302 |
| 2020 | $3,503 | $115,985 | $46,200 | $69,785 |
| 2019 | $3,401 | $110,403 | $41,650 | $68,753 |
| 2018 | $3,302 | $104,227 | $37,800 | $66,427 |
| 2017 | $3,127 | $102,299 | $35,700 | $66,599 |
| 2016 | $3,127 | $96,847 | $30,100 | $66,747 |
| 2015 | $3,120 | $93,186 | $27,300 | $65,886 |
| 2014 | $3,029 | $88,793 | $25,550 | $63,243 |
Source: Public Records
Map
Nearby Homes
- 10520 Shoalhaven Dr
- 10413 Broom Hill Dr
- 10404 Frostburg Ln
- 2501 Maddington Dr
- 10336 Frostburg Ln
- 2401 Ocean Edge Ct
- 2512 Maddington Dr
- 2620 Hanging Rock Dr
- 10409 Shoalhaven Dr
- 2413 Rockford St
- 2621 Hanging Rock Dr
- 10309 Broom Hill Dr
- 2712 Herons Creek Dr
- 2712 Breakers Creek Dr
- 2621 Breakers Creek Dr
- 10636 Argents Hill Dr
- 2231 Hallston St
- 10301 Coal Creek Place
- 10309 Georgetown Place
- 10321 Marymont Place
- 10440 Button Willow Dr
- 10508 Button Willow Dr
- 10436 Button Willow Dr Unit 42
- 10501 Button Willow Dr
- 10501 Button Willow Dr
- 10441 Button Willow Dr
- 10505 Button Willow Dr
- 10437 Button Willow Dr
- 10432 Button Willow Dr
- 10512 Button Willow Dr
- 10509 Button Willow Dr
- 10433 Button Willow Dr
- 10513 Button Willow Dr
- 10428 Button Willow Dr
- 10516 Button Willow Dr
- 10429 Button Willow Dr
- 10500 Broom Hill Dr
- 10440 Broom Hill Dr
- 10436 Broom Hill Dr
- 10504 Broom Hill Dr