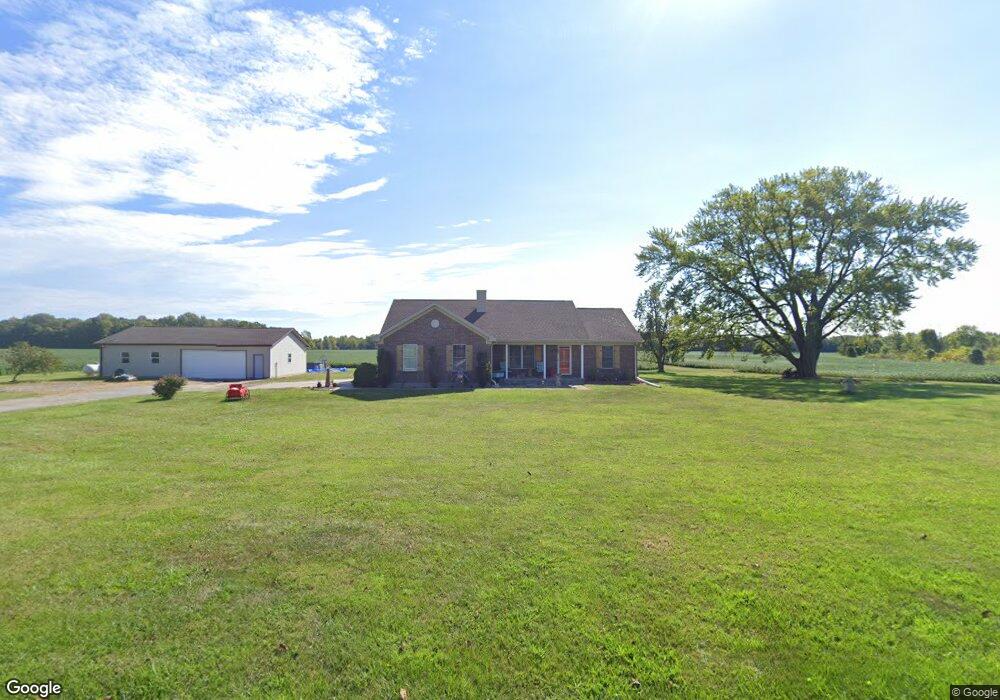
10500 N 725 W Carthage, IN 46115
Estimated Value: $300,000 - $370,777
3
Beds
2
Baths
1,572
Sq Ft
$215/Sq Ft
Est. Value
About This Home
This home is located at 10500 N 725 W, Carthage, IN 46115 and is currently estimated at $337,944, approximately $214 per square foot. 10500 N 725 W is a home located in Rush County with nearby schools including Knightstown Elementary School, Knightstown Intermediate School, and Knightstown High School.
Ownership History
Date
Name
Owned For
Owner Type
Purchase Details
Closed on
Jul 30, 2025
Sold by
Copass Richard and Copass Marsha J
Bought by
Dean Cameron J and Judd Kelly
Current Estimated Value
Home Financials for this Owner
Home Financials are based on the most recent Mortgage that was taken out on this home.
Original Mortgage
$294,057
Outstanding Balance
$293,551
Interest Rate
6.77%
Mortgage Type
FHA
Estimated Equity
$44,393
Purchase Details
Closed on
Mar 31, 2010
Sold by
Ruf Donald M and Ruf Angela R
Bought by
Copass Richard and Copass Marsha J
Home Financials for this Owner
Home Financials are based on the most recent Mortgage that was taken out on this home.
Original Mortgage
$170,060
Interest Rate
5.03%
Mortgage Type
VA
Purchase Details
Closed on
Jun 15, 2007
Sold by
Carroll Mark A
Bought by
Ruf Donald M and Ruf Angela R
Home Financials for this Owner
Home Financials are based on the most recent Mortgage that was taken out on this home.
Original Mortgage
$92,000
Interest Rate
6.26%
Mortgage Type
New Conventional
Create a Home Valuation Report for This Property
The Home Valuation Report is an in-depth analysis detailing your home's value as well as a comparison with similar homes in the area
Home Values in the Area
Average Home Value in this Area
Purchase History
| Date | Buyer | Sale Price | Title Company |
|---|---|---|---|
| Dean Cameron J | -- | First American Title | |
| Copass Richard | -- | None Available | |
| Ruf Donald M | -- | None Available |
Source: Public Records
Mortgage History
| Date | Status | Borrower | Loan Amount |
|---|---|---|---|
| Open | Dean Cameron J | $294,057 | |
| Previous Owner | Copass Richard | $170,060 | |
| Previous Owner | Ruf Donald M | $92,000 |
Source: Public Records
Tax History Compared to Growth
Tax History
| Year | Tax Paid | Tax Assessment Tax Assessment Total Assessment is a certain percentage of the fair market value that is determined by local assessors to be the total taxable value of land and additions on the property. | Land | Improvement |
|---|---|---|---|---|
| 2024 | $2,596 | $279,700 | $55,000 | $224,700 |
| 2023 | $2,880 | $262,000 | $50,900 | $211,100 |
| 2022 | $2,732 | $237,200 | $46,700 | $190,500 |
| 2021 | $2,419 | $204,300 | $40,600 | $163,700 |
| 2020 | $2,228 | $195,200 | $38,600 | $156,600 |
| 2019 | $1,896 | $177,800 | $36,100 | $141,700 |
| 2018 | $1,820 | $174,800 | $36,100 | $138,700 |
| 2017 | $1,746 | $171,800 | $36,100 | $135,700 |
| 2016 | $1,669 | $169,500 | $35,400 | $134,100 |
| 2014 | $1,576 | $166,100 | $35,400 | $130,700 |
| 2013 | $1,576 | $167,500 | $35,400 | $132,100 |
Source: Public Records
Map
Nearby Homes
- 726 N Main St
- 308 Winters Way
- 4 W Henley St
- 405 E 5th St
- 11020 W Us Highway 40
- 207 E Log St
- 307 Henley Ave
- 263 S Carthage Rd
- 225 S Carthage Rd
- 132 S East St
- 308 S West St
- 717 Henley Ave
- 315 Blue River Dr
- 306 Blue River Dr
- 308 Blue River Dr
- 324 Blue River Dr
- 307 Blue River Dr
- 8257 S County Road 1075 W
- 32 N Mccullum St
- 151 S Madison St
- 10500 N County Road 725 W
- 10388 N 725 W
- 10308 N 725 W
- 10244 N 725 W
- 10170 N 725 W
- 10164 N 725 W
- 10126 N 725 W
- 10464 N 725 W
- 7168 W 1000 N
- 7002 W 1000 N
- 10058 N 725 W
- 10021 N 725 W
- 7290 W 1000 N
- 7348 W 1000 N
- 7204 W 1000 N
- 6795 W 1100 N
- 7398 W 1000 N
- 7133 W 1100 N
- 7209 W 1000 N
- 7209 W County Road 1000 N