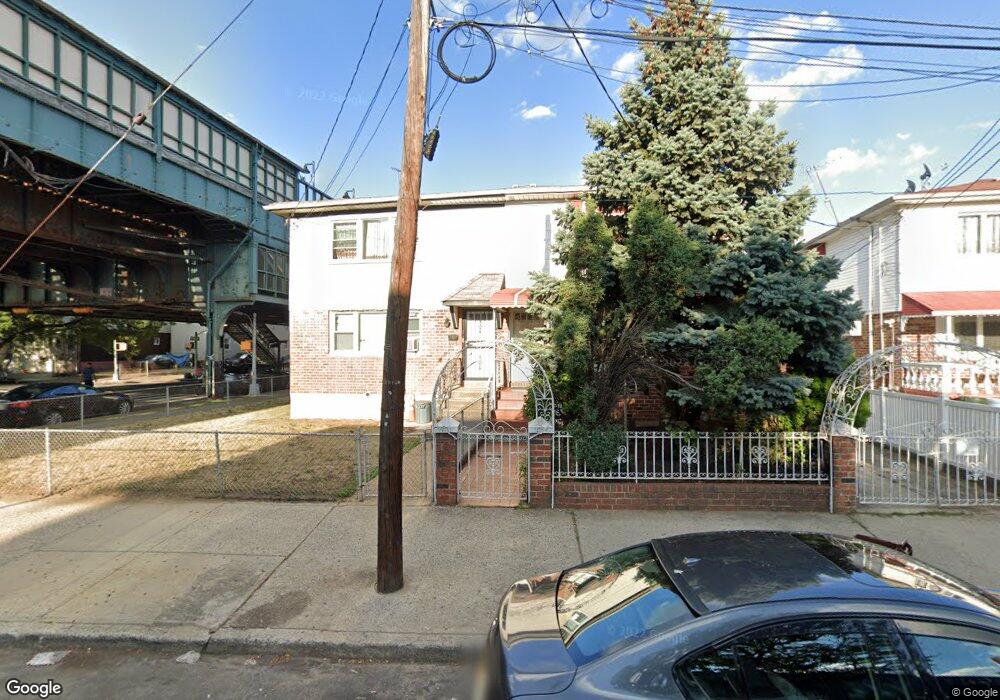
10501 79th St Ozone Park, NY 11417
Ozone Park NeighborhoodEstimated Value: $861,858 - $984,000
--
Bed
--
Bath
1,722
Sq Ft
$534/Sq Ft
Est. Value
About This Home
This home is located at 10501 79th St, Ozone Park, NY 11417 and is currently estimated at $919,215, approximately $533 per square foot. 10501 79th St is a home located in Queens County with nearby schools including P.S. 63 - Old South, Robert H. Goddard High School, and Cypress Hills Ascend Charter Lower School.
Ownership History
Date
Name
Owned For
Owner Type
Purchase Details
Closed on
Jun 20, 2018
Sold by
Angelo Liguori Michael and Herrmann Barbara J
Bought by
Ali Abdul and Haque Husneara
Current Estimated Value
Home Financials for this Owner
Home Financials are based on the most recent Mortgage that was taken out on this home.
Original Mortgage
$502,500
Outstanding Balance
$434,578
Interest Rate
4.5%
Mortgage Type
Purchase Money Mortgage
Estimated Equity
$484,637
Purchase Details
Closed on
Apr 8, 2014
Sold by
Liguori Michael Angelo
Bought by
Herrmann Barbara J and Liguori Michael Angelo
Create a Home Valuation Report for This Property
The Home Valuation Report is an in-depth analysis detailing your home's value as well as a comparison with similar homes in the area
Home Values in the Area
Average Home Value in this Area
Purchase History
| Date | Buyer | Sale Price | Title Company |
|---|---|---|---|
| Ali Abdul | $670,000 | -- | |
| Herrmann Barbara J | -- | -- |
Source: Public Records
Mortgage History
| Date | Status | Borrower | Loan Amount |
|---|---|---|---|
| Open | Ali Abdul | $502,500 |
Source: Public Records
Tax History Compared to Growth
Tax History
| Year | Tax Paid | Tax Assessment Tax Assessment Total Assessment is a certain percentage of the fair market value that is determined by local assessors to be the total taxable value of land and additions on the property. | Land | Improvement |
|---|---|---|---|---|
| 2025 | $7,526 | $39,718 | $10,321 | $29,397 |
| 2024 | $7,526 | $37,470 | $11,589 | $25,881 |
| 2023 | $7,100 | $35,350 | $10,773 | $24,577 |
| 2022 | $6,658 | $47,040 | $16,200 | $30,840 |
| 2021 | $7,019 | $43,620 | $16,200 | $27,420 |
| 2020 | $7,006 | $45,840 | $16,200 | $29,640 |
| 2019 | $6,532 | $41,640 | $16,200 | $25,440 |
| 2018 | $4,729 | $29,458 | $13,856 | $15,602 |
| 2017 | $4,778 | $27,792 | $13,188 | $14,604 |
| 2016 | $4,663 | $27,792 | $13,188 | $14,604 |
| 2015 | $2,655 | $27,582 | $15,612 | $11,970 |
| 2014 | $2,655 | $26,021 | $17,661 | $8,360 |
Source: Public Records
Map
Nearby Homes