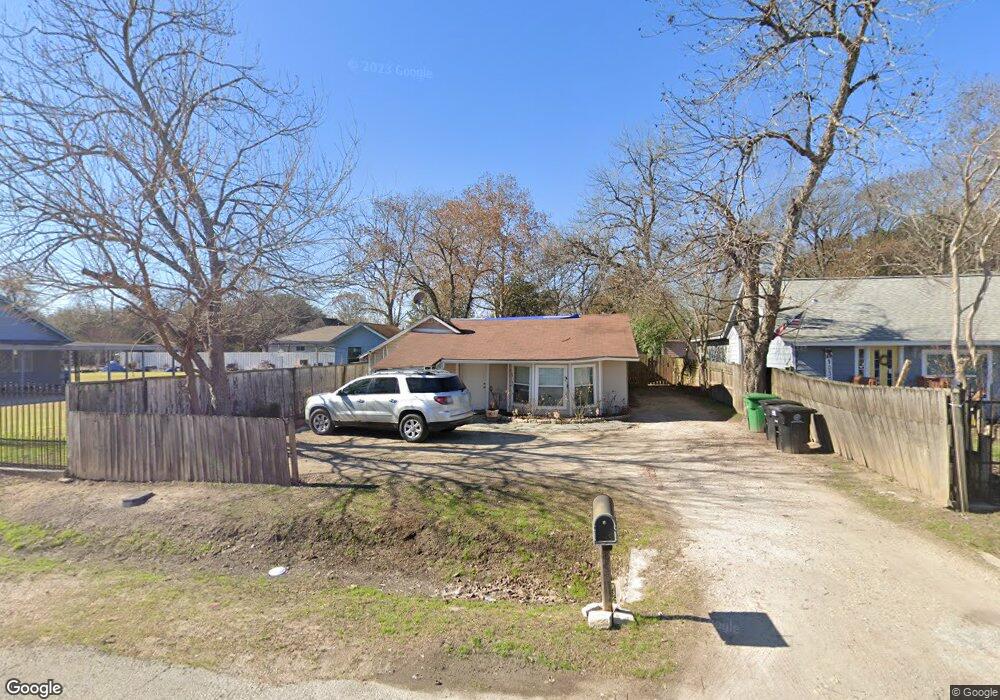
10501 Burden St Houston, TX 77093
Eastex-Jensen NeighborhoodEstimated Value: $179,408 - $231,000
3
Beds
1
Bath
1,448
Sq Ft
$135/Sq Ft
Est. Value
About This Home
This home is located at 10501 Burden St, Houston, TX 77093 and is currently estimated at $194,852, approximately $134 per square foot. 10501 Burden St is a home located in Harris County with nearby schools including Coop Elementary School, Patrick Henry Middle School, and Sam Houston Math, Science & Technology Center.
Ownership History
Date
Name
Owned For
Owner Type
Purchase Details
Closed on
Mar 14, 2012
Sold by
2011 Swe Homes Llc
Bought by
Ayala Sandra M and Barraza Samuel Escalera
Current Estimated Value
Home Financials for this Owner
Home Financials are based on the most recent Mortgage that was taken out on this home.
Original Mortgage
$40,300
Interest Rate
3.63%
Mortgage Type
Unknown
Purchase Details
Closed on
Jun 29, 2011
Sold by
Fannie Mae
Bought by
2011 Swe Homes Llc
Purchase Details
Closed on
Oct 5, 2010
Sold by
Iturriaga Norma and Toledo Antonio
Bought by
Federal National Mortgage Association
Purchase Details
Closed on
Oct 15, 2003
Sold by
Nelson Kenneth Ray and Contreras Isabel
Bought by
Toledo Antonio
Home Financials for this Owner
Home Financials are based on the most recent Mortgage that was taken out on this home.
Original Mortgage
$59,300
Interest Rate
6.1%
Mortgage Type
Purchase Money Mortgage
Create a Home Valuation Report for This Property
The Home Valuation Report is an in-depth analysis detailing your home's value as well as a comparison with similar homes in the area
Home Values in the Area
Average Home Value in this Area
Purchase History
| Date | Buyer | Sale Price | Title Company |
|---|---|---|---|
| Ayala Sandra M | -- | None Available | |
| 2011 Swe Homes Llc | -- | None Available | |
| Federal National Mortgage Association | $56,241 | None Available | |
| Toledo Antonio | -- | Fidelity National Title |
Source: Public Records
Mortgage History
| Date | Status | Borrower | Loan Amount |
|---|---|---|---|
| Previous Owner | Ayala Sandra M | $40,300 | |
| Previous Owner | Toledo Antonio | $59,300 |
Source: Public Records
Tax History Compared to Growth
Tax History
| Year | Tax Paid | Tax Assessment Tax Assessment Total Assessment is a certain percentage of the fair market value that is determined by local assessors to be the total taxable value of land and additions on the property. | Land | Improvement |
|---|---|---|---|---|
| 2025 | $1,227 | $122,000 | $64,063 | $57,937 |
| 2024 | $1,227 | $149,563 | $60,000 | $89,563 |
| 2023 | $1,227 | $122,714 | $46,875 | $75,839 |
| 2022 | $1,604 | $98,986 | $39,063 | $59,923 |
| 2021 | $1,111 | $62,587 | $28,125 | $34,462 |
| 2020 | $1,151 | $47,533 | $28,125 | $19,408 |
| 2019 | $1,140 | $47,533 | $28,125 | $19,408 |
| 2018 | $784 | $40,971 | $21,563 | $19,408 |
| 2017 | $1,036 | $40,971 | $21,563 | $19,408 |
| 2016 | $1,023 | $40,971 | $21,563 | $19,408 |
| 2015 | $945 | $36,774 | $17,188 | $19,586 |
| 2014 | $945 | $36,774 | $17,188 | $19,586 |
Source: Public Records
Map
Nearby Homes
- 10512 Exeter St
- 10514 Exeter St
- 2332 Margaret St
- 2315 Langley Rd
- 2415 Goodloe St
- 1829 Skinner Rd
- 2318 Cresline St
- 1908 Little York Rd
- 9910 E Hardy Rd
- 1731 Schilder Dr
- 2122 Kowis St
- 2633 Hollis St
- 1002 Grenfell Ln
- 2152 William Tell St
- 2636 Lone Oak Rd
- 1802 Kowis St
- 1728 Little York Rd
- 10022 E Hardy Rd
- 1930 Cromwell St
- 2629 Kowis St
- 10503 Burden St
- 2045 Margaret St
- 10505 Burden St
- 2047 Margaret St
- 10507 Burden St
- 10502 Burden St
- 10510 Burden St
- 2101 Margaret St
- 0 Margaret St
- 2044 Margaret St
- 2027 Margaret St
- 2107 Margaret St
- 2024 Margaret St
- 2019 Margaret St
- 2042 Margaret St
- 2102 Margaret St
- 2102 Margaret St Unit B
- 2102 Margaret St Unit A
- 2014 Skinner Rd
- 2111 Margaret St