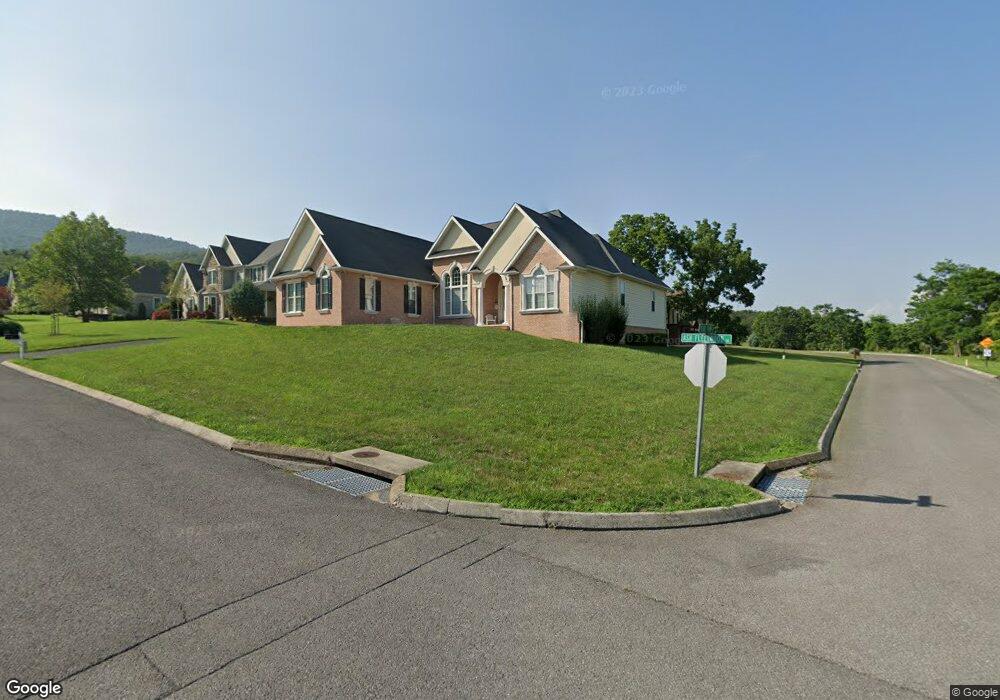
10501 Pearl View Place Cumberland, MD 21502
Estimated Value: $429,000 - $489,000
3
Beds
3
Baths
2,311
Sq Ft
$194/Sq Ft
Est. Value
About This Home
This home is located at 10501 Pearl View Place, Cumberland, MD 21502 and is currently estimated at $448,652, approximately $194 per square foot. 10501 Pearl View Place is a home located in Allegany County with nearby schools including Cash Valley Elementary School, Braddock Middle School, and Allegany High School.
Ownership History
Date
Name
Owned For
Owner Type
Purchase Details
Closed on
May 26, 2016
Sold by
Davis Ellen Louise
Bought by
Davis Ellen Louise
Current Estimated Value
Purchase Details
Closed on
Oct 29, 2010
Sold by
Crites Custom Homes Llc
Bought by
Davis Hubertr R and Davis Ellen L
Home Financials for this Owner
Home Financials are based on the most recent Mortgage that was taken out on this home.
Original Mortgage
$272,000
Outstanding Balance
$167,515
Interest Rate
3%
Mortgage Type
New Conventional
Estimated Equity
$281,137
Purchase Details
Closed on
Oct 9, 2008
Sold by
Berman Harold and Doan Y
Bought by
Crites Custom Homes Llc
Purchase Details
Closed on
Oct 1, 2008
Sold by
Berman Harold and Doan Y
Bought by
Crites Custom Homes Llc
Purchase Details
Closed on
Aug 2, 2005
Sold by
Bean Erich M
Bought by
Berman Harol
Purchase Details
Closed on
Aug 28, 2000
Sold by
Ashleigh Heights Llc
Bought by
Bean Erich M
Create a Home Valuation Report for This Property
The Home Valuation Report is an in-depth analysis detailing your home's value as well as a comparison with similar homes in the area
Home Values in the Area
Average Home Value in this Area
Purchase History
| Date | Buyer | Sale Price | Title Company |
|---|---|---|---|
| Davis Ellen Louise | -- | Attorney | |
| Davis Hubertr R | $340,000 | -- | |
| Crites Custom Homes Llc | $63,000 | -- | |
| Crites Custom Homes Llc | $63,000 | -- | |
| Berman Harol | $40,000 | -- | |
| Bean Erich M | $20,600 | -- |
Source: Public Records
Mortgage History
| Date | Status | Borrower | Loan Amount |
|---|---|---|---|
| Open | Davis Hubertr R | $272,000 |
Source: Public Records
Tax History Compared to Growth
Tax History
| Year | Tax Paid | Tax Assessment Tax Assessment Total Assessment is a certain percentage of the fair market value that is determined by local assessors to be the total taxable value of land and additions on the property. | Land | Improvement |
|---|---|---|---|---|
| 2025 | $4,224 | $342,867 | $0 | $0 |
| 2024 | $3,841 | $316,900 | $44,100 | $272,800 |
| 2023 | $3,350 | $308,233 | $0 | $0 |
| 2022 | $3,631 | $299,567 | $0 | $0 |
| 2021 | $3,523 | $290,900 | $47,500 | $243,400 |
| 2020 | $3,555 | $290,900 | $47,500 | $243,400 |
| 2019 | $3,526 | $290,900 | $47,500 | $243,400 |
| 2018 | $3,766 | $313,300 | $52,500 | $260,800 |
| 2017 | $3,763 | $313,300 | $0 | $0 |
| 2016 | $0 | $313,300 | $0 | $0 |
| 2015 | -- | $321,600 | $0 | $0 |
| 2014 | -- | $321,600 | $0 | $0 |
Source: Public Records
Map
Nearby Homes
- 313 National Hwy
- 11028 Ramblewood Dr NW
- 416 Georges Creek Blvd
- 554 A St
- 515 Georges Creek Blvd
- 204 Park Ave
- 519 Georges Creek Blvd
- 664 National Hwy
- 678 National Hwy
- 0 New York Ave
- 11023 Old Mount Savage Rd NW
- 310 Skyview Dr
- 913 Atlantic Ave
- 0 Cobey Dr Unit MDAL2012510
- 438 Carr Dr
- 1107 Cherrywood Ave
- 0 Atlantic Ave
- LOT 2 Cherrywood Ave
- 13 S Woodlawn Ave
- 73 Lavale Ct
- 10501 Pearl View Place
- 12109 Ash Fleetwood Dr
- 10503 Pearl View Place
- 10503 Pearl View Place
- 12208 Ash Fleetwood Dr
- 10500 Pearl View Place
- 12108 Ash Fleetwood Dr
- 12106 Ash Fleetwood Dr
- 12201 Ash Fleetwood Dr
- 12110 Ash Fleetwood Dr
- 10507 Pearl View Place
- 10601 Pearl View Place
- 12104 Ash Fleetwood Dr
- 10502 Pearl View Place
- 10603 Pearl View Place
- 12203 Ash Fleetwood Dr
- 12200 Ash Fleetwood Dr
- 12101 Ash Fleetwood Dr
- 67 Pearl View Place
- 10605 Pearl View Place