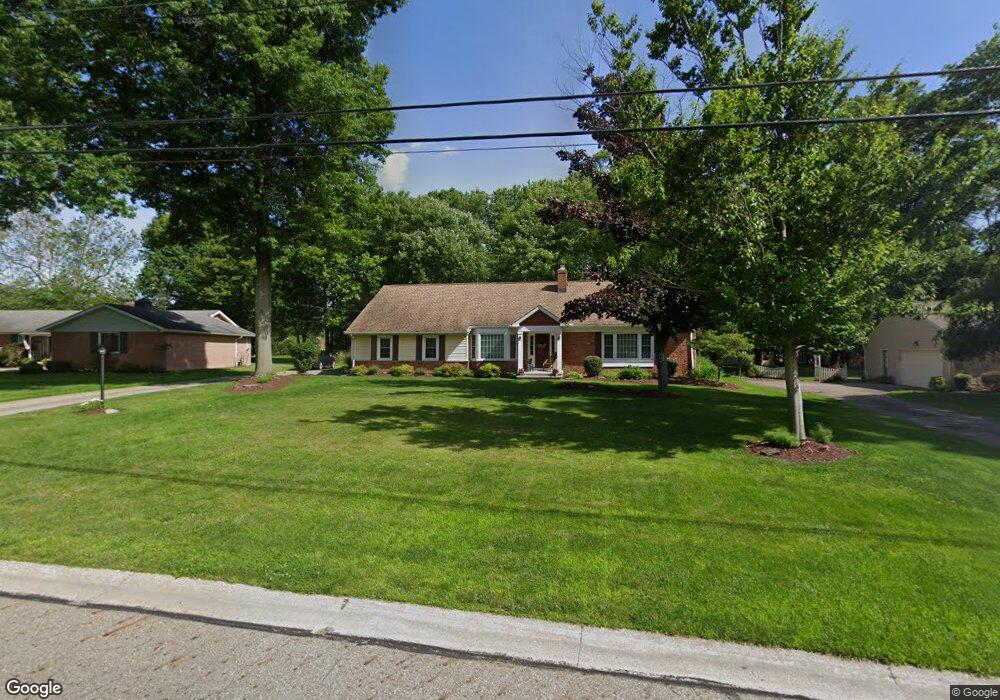
10501 Tanager Trail Brecksville, OH 44141
Estimated Value: $522,162 - $618,000
4
Beds
3
Baths
3,220
Sq Ft
$177/Sq Ft
Est. Value
About This Home
This home is located at 10501 Tanager Trail, Brecksville, OH 44141 and is currently estimated at $569,791, approximately $176 per square foot. 10501 Tanager Trail is a home located in Cuyahoga County with nearby schools including Brecksville-Broadview Heights Middle School, Brecksville-Broadview Heights High School, and St. Michael School.
Ownership History
Date
Name
Owned For
Owner Type
Purchase Details
Closed on
Jul 21, 2005
Sold by
Kapela Karen L and Slabe Thomas J
Bought by
Chermonte Daniel P and Chermonte Susan L
Current Estimated Value
Home Financials for this Owner
Home Financials are based on the most recent Mortgage that was taken out on this home.
Original Mortgage
$220,000
Outstanding Balance
$115,436
Interest Rate
5.74%
Mortgage Type
Purchase Money Mortgage
Estimated Equity
$454,355
Purchase Details
Closed on
Nov 29, 2002
Sold by
Lenart Marie
Bought by
Slabe Thomas J and Kapela Karen L
Home Financials for this Owner
Home Financials are based on the most recent Mortgage that was taken out on this home.
Original Mortgage
$120,000
Interest Rate
6.01%
Purchase Details
Closed on
Mar 10, 1985
Sold by
Lenart Louis and Lenart Marie
Bought by
Lenart Louis
Purchase Details
Closed on
Jan 1, 1975
Bought by
Lenart Louis and Lenart Marie
Create a Home Valuation Report for This Property
The Home Valuation Report is an in-depth analysis detailing your home's value as well as a comparison with similar homes in the area
Home Values in the Area
Average Home Value in this Area
Purchase History
| Date | Buyer | Sale Price | Title Company |
|---|---|---|---|
| Chermonte Daniel P | $305,000 | Real Living Title Agency L | |
| Slabe Thomas J | $289,500 | Real Living Title Agency Ltd | |
| Lenart Louis | -- | -- | |
| Lenart Louis | -- | -- |
Source: Public Records
Mortgage History
| Date | Status | Borrower | Loan Amount |
|---|---|---|---|
| Open | Chermonte Daniel P | $220,000 | |
| Closed | Slabe Thomas J | $120,000 |
Source: Public Records
Tax History Compared to Growth
Tax History
| Year | Tax Paid | Tax Assessment Tax Assessment Total Assessment is a certain percentage of the fair market value that is determined by local assessors to be the total taxable value of land and additions on the property. | Land | Improvement |
|---|---|---|---|---|
| 2024 | $9,229 | $165,725 | $24,115 | $141,610 |
| 2023 | $8,336 | $129,720 | $24,750 | $104,970 |
| 2022 | $8,510 | $129,710 | $24,750 | $104,970 |
| 2021 | $8,433 | $129,710 | $24,750 | $104,970 |
| 2020 | $7,461 | $102,940 | $19,640 | $83,300 |
| 2019 | $7,213 | $294,100 | $56,100 | $238,000 |
| 2018 | $7,162 | $102,940 | $19,640 | $83,300 |
| 2017 | $7,015 | $95,730 | $16,310 | $79,420 |
| 2016 | $6,395 | $95,730 | $16,310 | $79,420 |
| 2015 | $6,447 | $95,730 | $16,310 | $79,420 |
| 2014 | $6,447 | $94,790 | $16,140 | $78,650 |
Source: Public Records
Map
Nearby Homes
- 10303 Tanager Trail
- 7963 Seth Payne St
- 10612 Cardinal Ln
- 10403 Greenhaven Pkwy
- 8001 Robin Ln
- 10585 Whitewood Rd
- 7823 Oakhurst Cir
- 11004 Greenhaven Pkwy
- 8560 Timber Trail
- 6752 Rivercrest Dr
- 8435 Wiese Rd
- 7030 Carriage Hill Dr Unit 202
- 8304 Montello Rd
- 8630 Hollis Ln
- 7972 Brecksville Rd
- 6850 Carriage Hill Dr Unit D54
- 6850 Carriage Hill Dr
- 7608 Dalebrook Rd
- 8223 Montello Rd
- 0 Old Quarry Ln
- 10509 Tanager Trail
- 10447 Tanager Trail
- 10521 Tanager Trail
- 10506 Laurel Ln
- 10435 Tanager Trail
- 10512 Laurel Ln
- 10500 Laurel Ln
- 10520 Laurel Ln
- 10510 Tanager Trail
- 10533 Tanager Trail
- 10401 Tanager Trail
- 10502 Tanager Trail
- 10440 Tanager Trail
- 10532 Laurel Ln
- 10522 Tanager Trail
- 10327 Tanager Trail
- 10601 Tanager Trail
- 10428 Tanager Trail
- 10102 Fitzwater Rd
- 10534 Tanager Trail