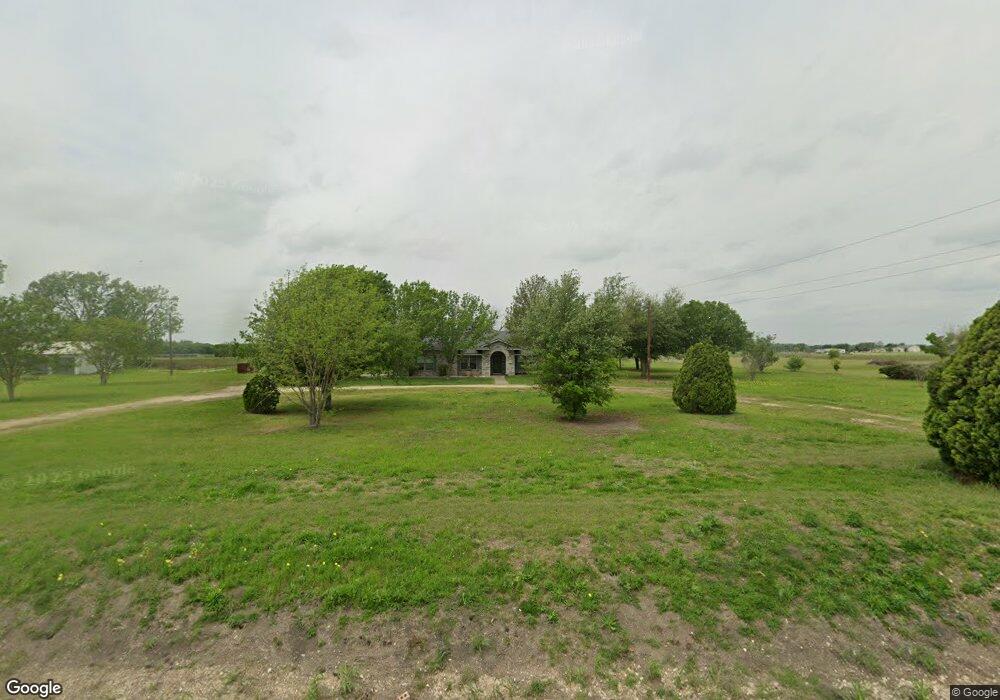
10505 Little Flock Rd Temple, TX 76501
North Temple NeighborhoodEstimated Value: $438,000 - $555,752
Studio
2
Baths
2,494
Sq Ft
$194/Sq Ft
Est. Value
About This Home
This home is located at 10505 Little Flock Rd, Temple, TX 76501 and is currently estimated at $484,251, approximately $194 per square foot. 10505 Little Flock Rd is a home located in Bell County with nearby schools including Rogers Elementary School, Rogers Middle, and Rogers High School.
Ownership History
Date
Name
Owned For
Owner Type
Purchase Details
Closed on
Dec 22, 2021
Sold by
Mims Edward and Mims Cami
Bought by
Mims Edward and Mims Cami
Current Estimated Value
Home Financials for this Owner
Home Financials are based on the most recent Mortgage that was taken out on this home.
Original Mortgage
$250,000
Outstanding Balance
$229,934
Interest Rate
3.11%
Mortgage Type
New Conventional
Estimated Equity
$254,317
Purchase Details
Closed on
Jul 13, 2021
Sold by
Eguia Gilbert and Eguia Margarita S
Bought by
Mims Cami Merrie
Home Financials for this Owner
Home Financials are based on the most recent Mortgage that was taken out on this home.
Original Mortgage
$162,400
Interest Rate
2.9%
Mortgage Type
Purchase Money Mortgage
Purchase Details
Closed on
Nov 29, 2018
Sold by
Mours Ivett Antonia
Bought by
Mims Edward
Create a Home Valuation Report for This Property
The Home Valuation Report is an in-depth analysis detailing your home's value as well as a comparison with similar homes in the area
Home Values in the Area
Average Home Value in this Area
Purchase History
| Date | Buyer | Sale Price | Title Company |
|---|---|---|---|
| Mims Edward | -- | None Available | |
| Mims Cami Merrie | -- | Centraland Title Company | |
| Mims Edward | -- | None Available |
Source: Public Records
Mortgage History
| Date | Status | Borrower | Loan Amount |
|---|---|---|---|
| Open | Mims Edward | $250,000 | |
| Closed | Mims Cami Merrie | $162,400 |
Source: Public Records
Tax History
| Year | Tax Paid | Tax Assessment Tax Assessment Total Assessment is a certain percentage of the fair market value that is determined by local assessors to be the total taxable value of land and additions on the property. | Land | Improvement |
|---|---|---|---|---|
| 2025 | $5,561 | $456,364 | -- | -- |
| 2024 | $5,569 | $456,364 | -- | -- |
| 2023 | $5,947 | $414,876 | $0 | $0 |
| 2022 | $6,105 | $377,160 | $0 | $0 |
| 2021 | $5,720 | $353,747 | $46,049 | $307,698 |
| 2020 | $5,373 | $314,628 | $46,049 | $268,579 |
| 2019 | $5,178 | $283,366 | $37,049 | $246,317 |
| 2018 | $4,747 | $259,523 | $33,959 | $225,564 |
| 2017 | $4,726 | $250,365 | $29,191 | $221,174 |
| 2016 | $4,484 | $237,516 | $24,424 | $213,092 |
| 2015 | -- | $233,381 | $24,424 | $208,957 |
| 2014 | -- | $229,653 | $0 | $0 |
Source: Public Records
Map
Nearby Homes
- 9562 State Highway 53
- 9562 State Hwy 53
- 9681 State Highway 53
- 0000 Texas 53
- Bluebonnet Lot: 0000 Texas 53
- Alamo Lot: 0000 Texas 53
- Javalina Lot: 0000 N Mockingbird Rd
- Copperhead Lot: 0000 N Mockingbird Rd
- Hawk Lot: 0000 N Mockingbird Rd
- Saguaro Lot: 0000 N Mockingbird Rd
- Sunshine Lot: 0000 N Mockingbird Rd
- Coyote Lot: 0000 N Mockingbird Rd
- Whitetail Lot: 0000 N Mockingbird Rd
- Jalapeno Lot: 0000 N Mockingbird Rd
- Catfish Lot: 0000 N Mockingbird Rd
- 310 Hruskaville Rd
- 4480 Cen-Tex Loop
- 4158 Creek Rd
- Unk
- 10966 Stringtown Rd
- 10559 Little Flock Rd
- 10607 Little Flock Rd
- 10363 Little Flock Rd
- 0000 Little Flock Rd
- 10161 Little Flock Rd
- 10173 Little Flock Rd
- 9721 State Highway 53
- 9989 State Highway 53
- 9990 Little Flock Rd
- 10093 Little Flock Rd
- 3571 Tower Rd
- 9303 Wedel Cemetery Rd
- 1709 N 18th St
- 900 E Houston Ave
- 5660 Little Flock Rd
- 408 W Royal Ave
- 0 Knob Creek Rd Unit 465545
- 3515 Stone Rd
- 9799 State Highway 53
- 9222 Little Flock Rd
Your Personal Tour Guide
Ask me questions while you tour the home.