Estimated Value: $193,561 - $277,000
3
Beds
1
Bath
1,225
Sq Ft
$183/Sq Ft
Est. Value
About This Home
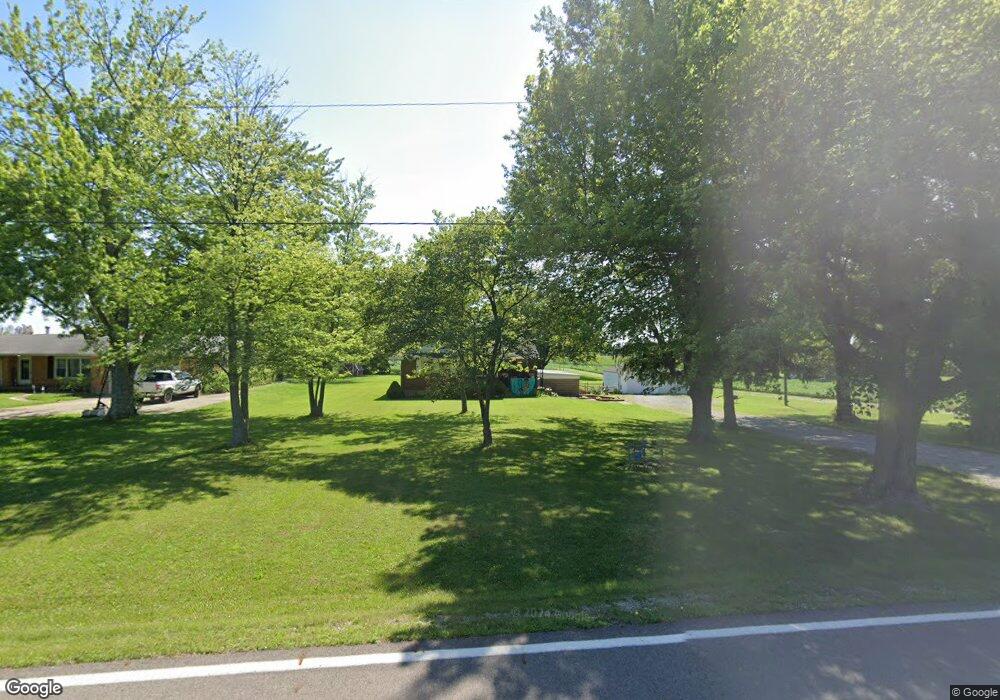
This home is located at 10505 N Reece Rd, Piqua, OH 45356 and is currently estimated at $224,390, approximately $183 per square foot. 10505 N Reece Rd is a home located in Miami County with nearby schools including Washington Primary School, Piqua Junior High School, and Piqua High School.
Ownership History
Date
Name
Owned For
Owner Type
Purchase Details
Closed on
Aug 27, 2016
Sold by
Schneider Jeffrey E and Reck Schneider Kendra A
Bought by
Schneider Shane A
Current Estimated Value
Purchase Details
Closed on
Mar 10, 2009
Sold by
Reck Joshua R and Reck Alanna M
Bought by
Schneider Kendra A Reck
Home Financials for this Owner
Home Financials are based on the most recent Mortgage that was taken out on this home.
Original Mortgage
$30,000
Outstanding Balance
$19,086
Interest Rate
5.14%
Mortgage Type
New Conventional
Estimated Equity
$205,304
Purchase Details
Closed on
Jan 12, 2009
Sold by
Reck Ruby L
Bought by
Schneider Kendra Arlene Reck and Reck Joshua R
Home Financials for this Owner
Home Financials are based on the most recent Mortgage that was taken out on this home.
Original Mortgage
$30,000
Outstanding Balance
$19,086
Interest Rate
5.14%
Mortgage Type
New Conventional
Estimated Equity
$205,304
Purchase Details
Closed on
May 1, 1985
Bought by
Reck Ruby L
Create a Home Valuation Report for This Property
The Home Valuation Report is an in-depth analysis detailing your home's value as well as a comparison with similar homes in the area
Home Values in the Area
Average Home Value in this Area
Purchase History
| Date | Buyer | Sale Price | Title Company |
|---|---|---|---|
| Schneider Shane A | -- | None Available | |
| Schneider Kendra A Reck | $47,450 | -- | |
| Schneider Kendra Arlene Reck | -- | -- | |
| Reck Ruby L | -- | -- |
Source: Public Records
Mortgage History
| Date | Status | Borrower | Loan Amount |
|---|---|---|---|
| Open | Schneider Kendra Arlene Reck | $30,000 |
Source: Public Records
Tax History Compared to Growth
Tax History
| Year | Tax Paid | Tax Assessment Tax Assessment Total Assessment is a certain percentage of the fair market value that is determined by local assessors to be the total taxable value of land and additions on the property. | Land | Improvement |
|---|---|---|---|---|
| 2024 | $1,940 | $42,670 | $9,280 | $33,390 |
| 2023 | $1,940 | $42,670 | $9,280 | $33,390 |
| 2022 | $1,803 | $42,670 | $9,280 | $33,390 |
| 2021 | $1,651 | $35,570 | $7,740 | $27,830 |
| 2020 | $1,619 | $35,570 | $7,740 | $27,830 |
| 2019 | $1,627 | $35,570 | $7,740 | $27,830 |
| 2018 | $1,568 | $32,730 | $7,700 | $25,030 |
| 2017 | $1,630 | $32,730 | $7,700 | $25,030 |
| 2016 | $1,612 | $32,730 | $7,700 | $25,030 |
| 2015 | $1,452 | $30,310 | $7,140 | $23,170 |
| 2014 | $1,452 | $30,310 | $7,140 | $23,170 |
| 2013 | $1,457 | $30,310 | $7,140 | $23,170 |
Source: Public Records
Map
Nearby Homes
- 2233 Landman Mill Rd
- 9606 Piqua Lockington Rd
- 1616 Echo Lake Dr
- 8846 N Hetzler Rd
- 8490 Bennett Dr
- 1516 Madison Ave
- 3 Lake Ridge Dr
- 1514 Nicklin Ave
- 1119 Anderson St
- 1507 Nicklin Ave
- 4510 W State Route 185
- 4528 W State Route 185
- 1206 Echo Lake Dr
- 1302 Broadway
- 10222 Augusta Ln
- 1115 Madison Ave
- 515 Scott St
- 10525 N Reece Rd
- 10455 N Reece Rd
- 10555 N Reece Rd
- 10290 N Reece Rd
- 10285 N Reece Rd
- 10495 N Reece Rd
- 10265 N Reece Rd
- 10225 N Reece Rd
- 10200 N Reece Rd
- 10220 State Route 66
- 10180 N Reece Rd
- 10151 N Reece Rd
- 10085 State Route 66
- 10085 Ohio 66
- 3133 Shawnee Trail
- 3133 Shawnee Trail
- 10544 State Route 66
- 10079 State Route 66
- 10079 Ohio 66
- 3105 Shawnee Trail