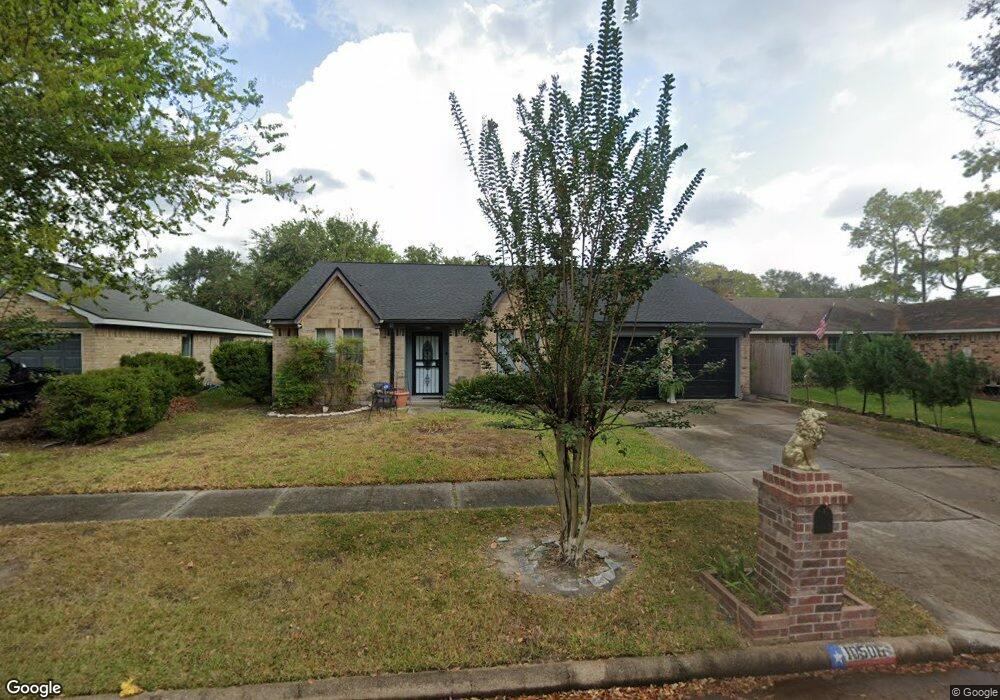
10506 Canyoncrest Ln Houston, TX 77086
North Houston NeighborhoodEstimated Value: $214,995 - $256,000
3
Beds
2
Baths
1,518
Sq Ft
$157/Sq Ft
Est. Value
About This Home
This home is located at 10506 Canyoncrest Ln, Houston, TX 77086 and is currently estimated at $238,249, approximately $156 per square foot. 10506 Canyoncrest Ln is a home located in Harris County with nearby schools including Kujawa EC/Pre-K/K School, Kujawa Elementary School, and Shotwell Middle School.
Ownership History
Date
Name
Owned For
Owner Type
Purchase Details
Closed on
May 18, 2006
Sold by
World Savings Bank
Bought by
Palma Victor
Current Estimated Value
Home Financials for this Owner
Home Financials are based on the most recent Mortgage that was taken out on this home.
Original Mortgage
$88,065
Outstanding Balance
$51,004
Interest Rate
6.4%
Mortgage Type
Fannie Mae Freddie Mac
Estimated Equity
$187,245
Purchase Details
Closed on
Feb 7, 2006
Sold by
Carvajal Juan P
Bought by
World Savings Bank Fsb
Purchase Details
Closed on
May 29, 2002
Sold by
Robison Clayton G and Robison Cathy H
Bought by
Carvajal Juan P
Home Financials for this Owner
Home Financials are based on the most recent Mortgage that was taken out on this home.
Original Mortgage
$85,405
Interest Rate
6.92%
Mortgage Type
Stand Alone First
Create a Home Valuation Report for This Property
The Home Valuation Report is an in-depth analysis detailing your home's value as well as a comparison with similar homes in the area
Home Values in the Area
Average Home Value in this Area
Purchase History
| Date | Buyer | Sale Price | Title Company |
|---|---|---|---|
| Palma Victor | -- | Chicago Title | |
| World Savings Bank Fsb | $83,000 | None Available | |
| Carvajal Juan P | -- | Chicago Title |
Source: Public Records
Mortgage History
| Date | Status | Borrower | Loan Amount |
|---|---|---|---|
| Open | Palma Victor | $88,065 | |
| Previous Owner | Carvajal Juan P | $85,405 |
Source: Public Records
Tax History Compared to Growth
Tax History
| Year | Tax Paid | Tax Assessment Tax Assessment Total Assessment is a certain percentage of the fair market value that is determined by local assessors to be the total taxable value of land and additions on the property. | Land | Improvement |
|---|---|---|---|---|
| 2025 | $2,387 | $210,468 | $39,117 | $171,351 |
| 2024 | $2,387 | $212,170 | $39,117 | $173,053 |
| 2023 | $2,387 | $220,534 | $39,117 | $181,417 |
| 2022 | $3,154 | $182,948 | $33,150 | $149,798 |
| 2021 | $2,860 | $152,454 | $33,150 | $119,304 |
| 2020 | $2,891 | $144,332 | $33,150 | $111,182 |
| 2019 | $2,732 | $120,000 | $14,628 | $105,372 |
| 2018 | $912 | $118,266 | $14,628 | $103,638 |
| 2017 | $2,177 | $118,266 | $14,628 | $103,638 |
| 2016 | $1,979 | $103,478 | $14,628 | $88,850 |
| 2015 | $1,363 | $103,478 | $14,628 | $88,850 |
| 2014 | $1,363 | $77,100 | $14,628 | $62,472 |
Source: Public Records
Map
Nearby Homes
- 10307 Bammel North Houston Rd
- 7302 Seton Lake Dr
- 7307 Silver Star Dr
- 10614 Mackenzie Dr
- 7023 Sandswept Ln
- 10711 Heather Hill Dr
- 6911 Silver Star Dr
- 10723 Mackenzie Dr
- 7002 Sandswept Ln
- 7218 Winding Trace Dr
- 6822 Dusty Dawn Dr
- 9815 Lonsford Dr
- 7222 Northleaf Dr
- 6830 Desert Rose Ln
- 7227 Greenyard Dr
- 6722 Winding Trace Dr
- 7011 Lower Arrow Dr
- 10306 Jillana Kaye Dr
- 6654 Brownie Campbell Rd
- 6703 Deer Ridge Ln
- 10510 Canyoncrest Ln
- 10502 Canyoncrest Ln
- 10514 Canyoncrest Ln
- 10430 Canyoncrest Ln
- 7206 Pebblemill Ln
- 10518 Canyoncrest Ln
- 10426 Canyoncrest Ln
- 10515 Canyoncrest Ln
- 7210 Pebblemill Ln
- 10511 Mackenzie Dr
- 7203 Pebblemill Ln
- 10507 Mackenzie Dr
- 10515 Mackenzie Dr
- 10503 Mackenzie Dr
- 10522 Canyoncrest Ln
- 10519 Canyoncrest Ln
- 10422 Canyoncrest Ln
- 10519 Mackenzie Dr
- 7207 Pebblemill Ln
- 10435 Mackenzie Dr