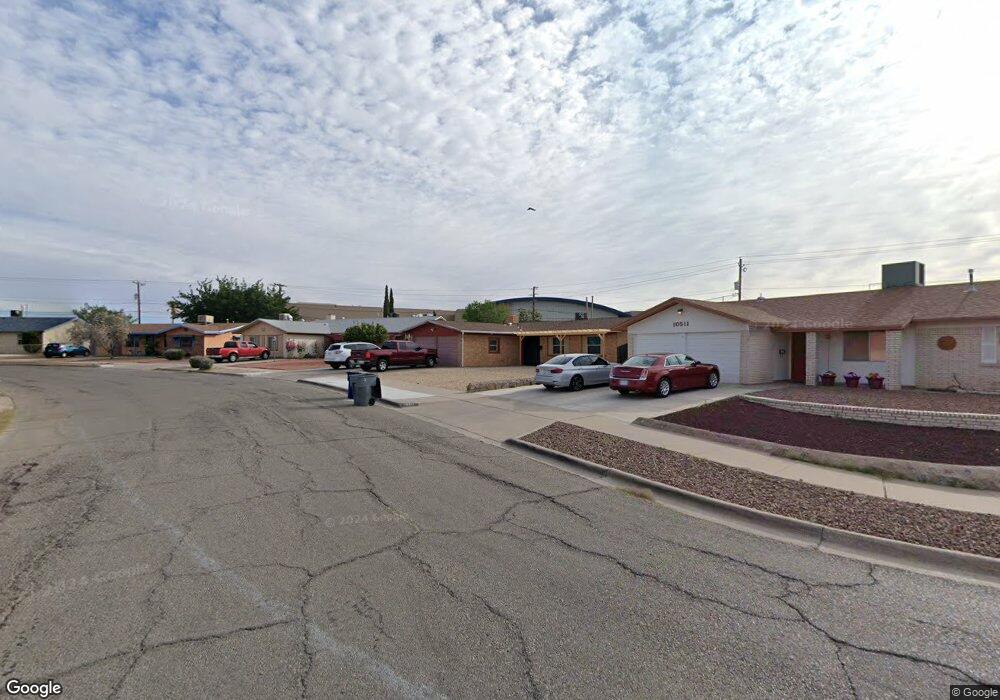
10509 Cuesta Brava Ln El Paso, TX 79935
Pico Norte NeighborhoodEstimated Value: $182,000 - $202,328
--
Bed
2
Baths
1,238
Sq Ft
$156/Sq Ft
Est. Value
About This Home
This home is located at 10509 Cuesta Brava Ln, El Paso, TX 79935 and is currently estimated at $192,582, approximately $155 per square foot. 10509 Cuesta Brava Ln is a home located in El Paso County with nearby schools including East Point Elementary School, Eastwood Middle School, and Eastwood High School.
Ownership History
Date
Name
Owned For
Owner Type
Purchase Details
Closed on
Sep 26, 2012
Sold by
Mendoza Leopoldo
Bought by
Labrado Jose L
Current Estimated Value
Home Financials for this Owner
Home Financials are based on the most recent Mortgage that was taken out on this home.
Original Mortgage
$86,743
Outstanding Balance
$61,075
Interest Rate
3.87%
Mortgage Type
FHA
Estimated Equity
$131,507
Purchase Details
Closed on
Feb 25, 2002
Sold by
Castillo Ramon and Castillo Maria Elizabeth
Bought by
Mendoza Leopoldo
Home Financials for this Owner
Home Financials are based on the most recent Mortgage that was taken out on this home.
Original Mortgage
$52,577
Interest Rate
6.93%
Mortgage Type
FHA
Purchase Details
Closed on
Mar 25, 1998
Sold by
Torres Manuel
Bought by
Mendoza Leo and Mendoza Elizabeth
Purchase Details
Closed on
Aug 12, 1997
Sold by
Benavente Anita and Torres Gloria
Bought by
Mendoza Elizabeth and Mendoza Leopoldo
Create a Home Valuation Report for This Property
The Home Valuation Report is an in-depth analysis detailing your home's value as well as a comparison with similar homes in the area
Home Values in the Area
Average Home Value in this Area
Purchase History
| Date | Buyer | Sale Price | Title Company |
|---|---|---|---|
| Labrado Jose L | -- | Great Western Abstract & Tit | |
| Mendoza Leopoldo | -- | -- | |
| Mendoza Leo | -- | -- | |
| Mendoza Elizabeth | -- | -- |
Source: Public Records
Mortgage History
| Date | Status | Borrower | Loan Amount |
|---|---|---|---|
| Open | Labrado Jose L | $86,743 | |
| Previous Owner | Mendoza Leopoldo | $52,577 |
Source: Public Records
Tax History Compared to Growth
Tax History
| Year | Tax Paid | Tax Assessment Tax Assessment Total Assessment is a certain percentage of the fair market value that is determined by local assessors to be the total taxable value of land and additions on the property. | Land | Improvement |
|---|---|---|---|---|
| 2025 | $2,738 | $177,816 | -- | -- |
| 2024 | $2,738 | $161,651 | -- | -- |
| 2023 | $2,524 | $146,955 | $0 | $0 |
| 2022 | $4,149 | $133,595 | $0 | $0 |
| 2021 | $3,948 | $121,450 | $16,141 | $105,309 |
| 2020 | $4,126 | $130,639 | $16,141 | $114,498 |
| 2018 | $4,031 | $129,613 | $16,141 | $113,472 |
| 2017 | $3,651 | $119,436 | $16,141 | $103,295 |
| 2016 | $3,518 | $115,087 | $16,141 | $98,946 |
| 2015 | $3,560 | $115,087 | $16,141 | $98,946 |
| 2014 | $3,560 | $124,436 | $16,141 | $108,295 |
Source: Public Records
Map
Nearby Homes
- 10512 Album Ave
- 2701 Brady Place
- 2412 Penwood Dr
- 2801 Brady Place
- 2224 Escarpa Dr
- 2705 Fierro Dr
- 2912 Chaswood St
- 2105 Pacheco Dr
- 10309 Woodruff Ct
- 10304 Woodruff Ct
- 3000 Woodall St
- 2109 Febrero Dr
- 3101 Vogue Dr
- 10304 Blackwood Ave
- 3150 N Yarbrough Dr Unit A1
- 10313 Byway Dr
- 3112 Eads Place
- 1909 Crow Dr
- 10301 Bayo Ave
- 10712 Gay Brewer Dr
- 10511 Cuesta Brava Ln
- 10507 Cuesta Brava Ln
- 10529 Cuesta Brava Ln
- 10505 Cuesta Brava Ln
- 10533 Cuesta Brava Ln
- 10506 Cuesta Brava Ln
- 10504 Album Ave
- 10510 Cuesta Brava Ln
- 10500 Album Ave
- 10508 Album Ave
- 10444 Album Ave
- 10503 Cuesta Brava Ln
- 10537 Cuesta Brava Ln
- 10524 Cuesta Brava Ln
- 10440 Album Ave
- 10512 Cuesta Brava Ln
- 10520 Cuesta Brava Ln
- 10528 Cuesta Brava Ln
- 2404 Chaswood St
- 2408 Chaswood St