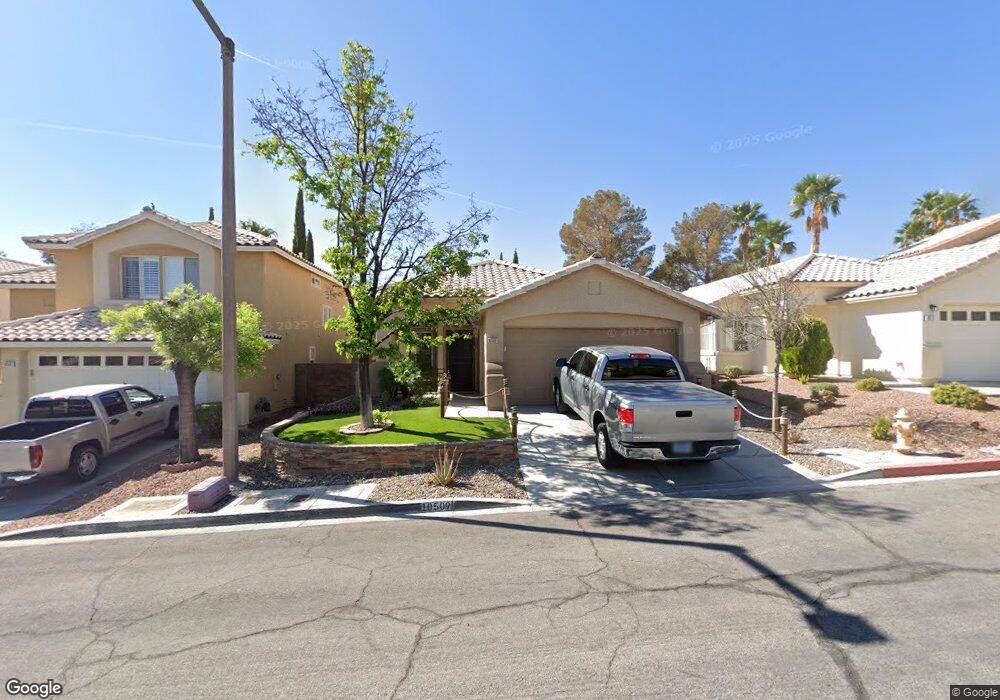
10509 Prime View Ct Unit 1 Las Vegas, NV 89144
Summerlin NeighborhoodEstimated Value: $476,178 - $493,000
3
Beds
2
Baths
1,430
Sq Ft
$340/Sq Ft
Est. Value
About This Home
This home is located at 10509 Prime View Ct Unit 1, Las Vegas, NV 89144 and is currently estimated at $485,795, approximately $339 per square foot. 10509 Prime View Ct Unit 1 is a home located in Clark County with nearby schools including John W. Bonner Elementary School, Sig Rogich Middle School, and Palo Verde High School.
Ownership History
Date
Name
Owned For
Owner Type
Purchase Details
Closed on
Sep 16, 2004
Sold by
Barikzi Ahmed K and Barikzi Maliha
Bought by
Patapoff Gary M
Current Estimated Value
Home Financials for this Owner
Home Financials are based on the most recent Mortgage that was taken out on this home.
Original Mortgage
$210,000
Outstanding Balance
$103,969
Interest Rate
5.87%
Mortgage Type
Unknown
Estimated Equity
$381,826
Purchase Details
Closed on
Sep 15, 2004
Sold by
Patapoff Anne A
Bought by
Patapoff Gary
Home Financials for this Owner
Home Financials are based on the most recent Mortgage that was taken out on this home.
Original Mortgage
$210,000
Outstanding Balance
$103,969
Interest Rate
5.87%
Mortgage Type
Unknown
Estimated Equity
$381,826
Purchase Details
Closed on
Oct 23, 1996
Sold by
Lewis Homes Of Nevada
Bought by
Barikzi Ahmed K and Barikzi Maliha
Home Financials for this Owner
Home Financials are based on the most recent Mortgage that was taken out on this home.
Original Mortgage
$92,500
Interest Rate
8.3%
Create a Home Valuation Report for This Property
The Home Valuation Report is an in-depth analysis detailing your home's value as well as a comparison with similar homes in the area
Home Values in the Area
Average Home Value in this Area
Purchase History
| Date | Buyer | Sale Price | Title Company |
|---|---|---|---|
| Patapoff Gary M | $300,000 | First American Title Co Of | |
| Patapoff Gary | -- | First American Title Co Of | |
| Barikzi Ahmed K | $121,500 | Land Title |
Source: Public Records
Mortgage History
| Date | Status | Borrower | Loan Amount |
|---|---|---|---|
| Open | Patapoff Gary M | $210,000 | |
| Previous Owner | Barikzi Ahmed K | $92,500 |
Source: Public Records
Tax History Compared to Growth
Tax History
| Year | Tax Paid | Tax Assessment Tax Assessment Total Assessment is a certain percentage of the fair market value that is determined by local assessors to be the total taxable value of land and additions on the property. | Land | Improvement |
|---|---|---|---|---|
| 2025 | $2,082 | $101,147 | $46,200 | $54,947 |
| 2024 | $2,022 | $101,147 | $46,200 | $54,947 |
| 2023 | $2,022 | $85,549 | $33,250 | $52,299 |
| 2022 | $1,963 | $76,142 | $28,350 | $47,792 |
| 2021 | $1,906 | $72,179 | $26,600 | $45,579 |
| 2020 | $1,811 | $69,358 | $25,200 | $44,158 |
| 2019 | $1,789 | $65,693 | $22,050 | $43,643 |
| 2018 | $1,707 | $57,269 | $18,200 | $39,069 |
| 2017 | $1,836 | $55,825 | $16,450 | $39,375 |
| 2016 | $1,599 | $53,455 | $13,650 | $39,805 |
| 2015 | $1,595 | $49,527 | $10,150 | $39,377 |
| 2014 | $1,545 | $46,802 | $7,350 | $39,452 |
Source: Public Records
Map
Nearby Homes
- 10505 Prime View Ct
- 916 Autumn Royal Ln
- 10424 Beachwalk Place
- 10600 Olivebranch Ave
- 10400 Beachwalk Place
- 10501 Pacific Palisades Ave
- 901 Royal Birch Ln Unit 1
- 10645 Redwood Grove Ave
- 10432 American Falls Ln
- 901 Cambridge Cross Place
- 428 Madison Taylor Place
- 10657 Blue Nile Ct
- 412 Carlton Kay Place
- 10665 Blue Nile Ct
- 10247 Amber Hue Ln
- 10673 Blue Nile Ct
- 10665 Sapphire Vista Ave
- 340 Autumn Palace Ct
- 425 Blush Creek Place
- 1201 Mersault Ct
- 10513 Prime View Ct
- 10501 Prime View Ct
- 10517 Prime View Ct Unit 1
- 10500 Shadowland Ave
- 10432 Shadowland Ave
- 10428 Shadowland Ave
- 10504 Shadowland Ave
- 10421 Prime View Ct
- 10521 Prime View Ct
- 10508 Prime View Ct
- 10424 Shadowland Ave
- 10508 Shadowland Ave
- 10512 Prime View Ct Unit house
- 10512 Prime View Ct
- 10504 Prime View Ct
- 10417 Prime View Ct
- 10500 Prime View Ct
- 10420 Shadowland Ave
- 10512 Shadowland Ave
- 10520 Prime View Ct