Estimated Value: $778,330
--
Bed
2
Baths
6,500
Sq Ft
$120/Sq Ft
Est. Value
About This Home
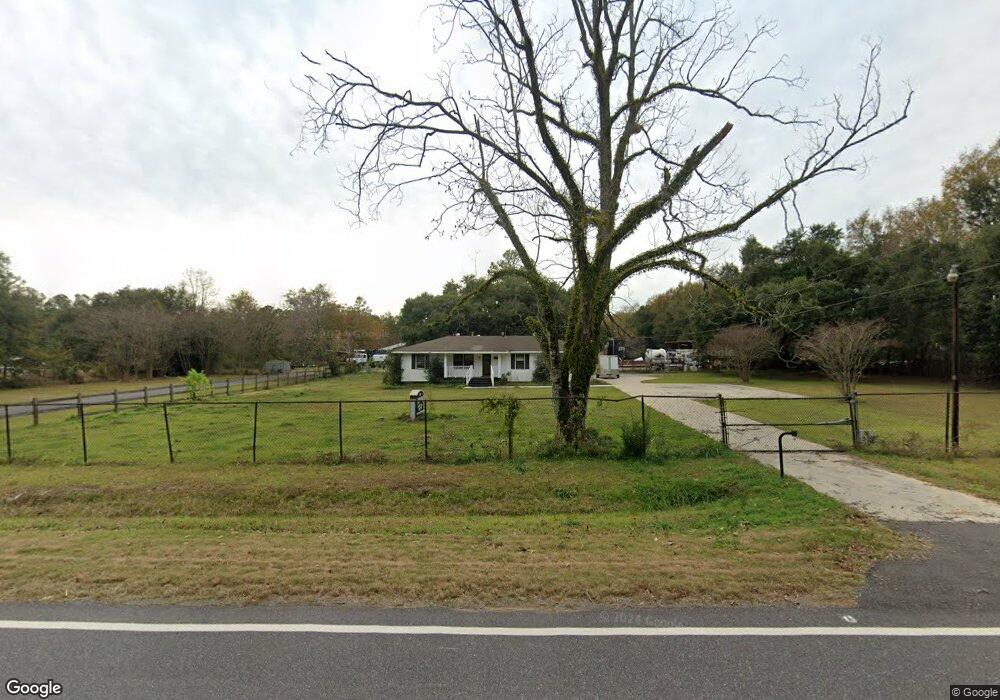
This home is located at 1051 Creola Axis Loop Rd N, Axis, AL 36505 and is currently estimated at $778,330, approximately $119 per square foot. 1051 Creola Axis Loop Rd N is a home located in Mobile County with nearby schools including North Mobile County Middle School and Citronelle High School.
Ownership History
Date
Name
Owned For
Owner Type
Purchase Details
Closed on
Dec 4, 2024
Sold by
Justice Properties Inc
Bought by
Ssp Creola Axis Llc
Current Estimated Value
Home Financials for this Owner
Home Financials are based on the most recent Mortgage that was taken out on this home.
Original Mortgage
$585,000
Outstanding Balance
$580,173
Interest Rate
6.54%
Mortgage Type
Seller Take Back
Estimated Equity
$198,157
Purchase Details
Closed on
Jul 30, 2019
Sold by
Industrial Cleaning Contractors Of Jacks
Bought by
Justice Properties Inc
Purchase Details
Closed on
Feb 29, 2008
Sold by
Mims Annie W and Cain Judy M
Bought by
Industrial Cleaning Contractors Of Jacks
Home Financials for this Owner
Home Financials are based on the most recent Mortgage that was taken out on this home.
Original Mortgage
$70,530
Interest Rate
5.46%
Mortgage Type
Purchase Money Mortgage
Create a Home Valuation Report for This Property
The Home Valuation Report is an in-depth analysis detailing your home's value as well as a comparison with similar homes in the area
Home Values in the Area
Average Home Value in this Area
Purchase History
| Date | Buyer | Sale Price | Title Company |
|---|---|---|---|
| Ssp Creola Axis Llc | $745,000 | Delta South Title Inc | |
| Justice Properties Inc | -- | None Available | |
| Industrial Cleaning Contractors Of Jacks | $119,900 | Reli Inc |
Source: Public Records
Mortgage History
| Date | Status | Borrower | Loan Amount |
|---|---|---|---|
| Open | Ssp Creola Axis Llc | $585,000 | |
| Previous Owner | Industrial Cleaning Contractors Of Jacks | $70,530 |
Source: Public Records
Tax History Compared to Growth
Tax History
| Year | Tax Paid | Tax Assessment Tax Assessment Total Assessment is a certain percentage of the fair market value that is determined by local assessors to be the total taxable value of land and additions on the property. | Land | Improvement |
|---|---|---|---|---|
| 2024 | $6,611 | $140,140 | $17,500 | $122,640 |
| 2023 | $6,797 | $103,920 | $17,500 | $86,420 |
| 2022 | $6,157 | $126,940 | $26,060 | $100,880 |
| 2021 | $3,117 | $64,260 | $8,660 | $55,600 |
| 2020 | $3,182 | $65,600 | $8,660 | $56,940 |
| 2019 | $2,499 | $51,520 | $0 | $0 |
| 2018 | $2,528 | $52,120 | $0 | $0 |
| 2017 | $2,635 | $54,340 | $0 | $0 |
| 2016 | $2,668 | $55,020 | $0 | $0 |
| 2013 | $2,629 | $53,740 | $0 | $0 |
Source: Public Records
Map
Nearby Homes
- 11525 Highway 43 N
- 11286 Highway 43
- 630 Mcbride Cir N Unit A
- 11286 U S 43
- 11045 Hurst Dr
- 565 Wilson Blvd
- 10901 Hall Dr Unit 20
- 0 Mcbride Cir S Unit 7098358
- 0 Bell Dr Unit 3 0658885
- 0 Bell Dr Unit 5 0658878
- 0 Dead Lake Marina Rd Unit 7360688
- 10820 Old Highway 43
- 180 Creax Rd
- 0 Lucas Rd Unit 7685894
- 1931 Dead Lake Marina Rd
- 0 Highway 43 N Unit 7537989
- 0 Highway 43 N Unit 7538007
- 10179 Hardy Dr
- 0 Sailor Rd
- 0 Dead Lake Rd Unit 25467477
- 1077 Creola Axis Loop Rd N
- 1439 Creola Axis Loop Rd N
- 857 Creola Axis Loop Rd N
- 944 Country Ln
- 975 Creola Axis Loop Rd N
- 928 Country Ln
- 11190C Dan Churchman Rd
- 863 Creola Axis Loop Rd N
- 943 Country Ln
- 896 Country Ln
- 927 Country Ln
- 911 Country Ln
- 880 Country Ln
- 895 Country Ln
- 864 Country Ln
- 827 Creola Axis Loop Rd N
- 849 Creola Axis Loop Rd N
- 850 Country Ln
- 832 Country Ln
- 920 Wilson Blvd