Estimated Value: $394,000 - $438,000
3
Beds
4
Baths
1,720
Sq Ft
$242/Sq Ft
Est. Value
About This Home
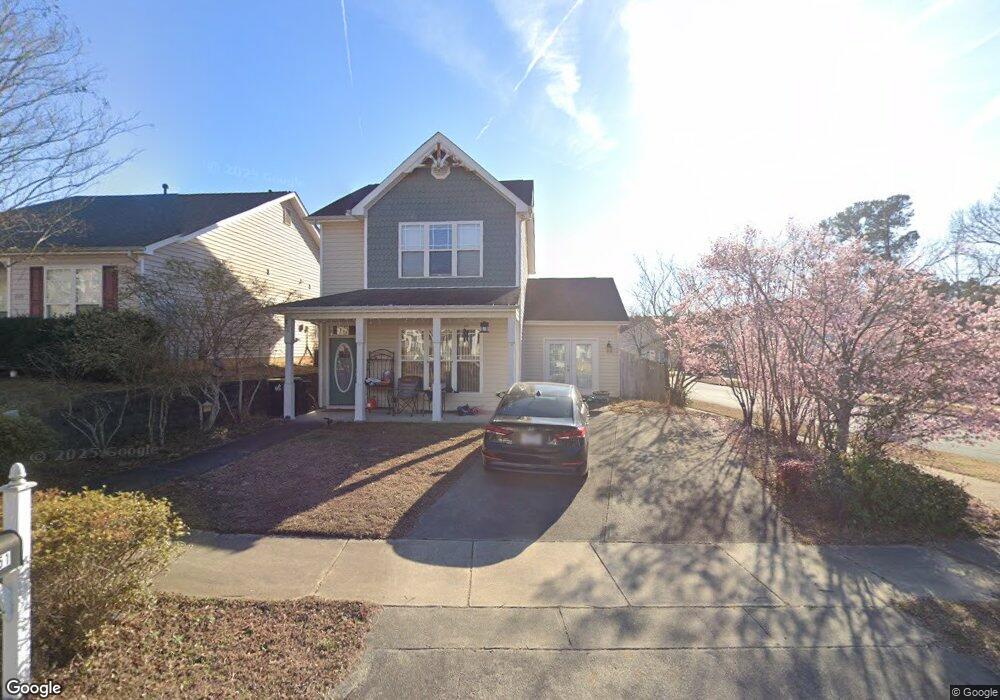
This home is located at 1051 Dual Parks Rd, Apex, NC 27502 and is currently estimated at $415,396, approximately $241 per square foot. 1051 Dual Parks Rd is a home located in Wake County with nearby schools including Apex Elementary School, Apex Middle, and Apex High School.
Ownership History
Date
Name
Owned For
Owner Type
Purchase Details
Closed on
Sep 26, 2016
Sold by
Rrcap Sfr I Llc
Bought by
Csh Property One Llc
Current Estimated Value
Purchase Details
Closed on
May 20, 2016
Sold by
Dc Residential Acquisition Company Llc
Bought by
Rrcap Sfr I Llc
Purchase Details
Closed on
May 19, 2016
Sold by
Chtistiana Trust
Bought by
Dc Residential Acquisition Company Llc
Purchase Details
Closed on
Oct 8, 2014
Sold by
Nash Mark A
Bought by
Christiana Trust
Purchase Details
Closed on
Dec 15, 2004
Sold by
Homeplaces Llc
Bought by
Kash Mark A
Home Financials for this Owner
Home Financials are based on the most recent Mortgage that was taken out on this home.
Original Mortgage
$120,720
Interest Rate
7.75%
Mortgage Type
New Conventional
Create a Home Valuation Report for This Property
The Home Valuation Report is an in-depth analysis detailing your home's value as well as a comparison with similar homes in the area
Home Values in the Area
Average Home Value in this Area
Purchase History
| Date | Buyer | Sale Price | Title Company |
|---|---|---|---|
| Csh Property One Llc | $178,000 | None Available | |
| Rrcap Sfr I Llc | $155,500 | None Available | |
| Dc Residential Acquisition Company Llc | -- | None Available | |
| Christiana Trust | $189,054 | None Available | |
| Kash Mark A | $151,000 | -- |
Source: Public Records
Mortgage History
| Date | Status | Borrower | Loan Amount |
|---|---|---|---|
| Previous Owner | Kash Mark A | $120,720 | |
| Closed | Kash Mark A | $30,190 |
Source: Public Records
Tax History Compared to Growth
Tax History
| Year | Tax Paid | Tax Assessment Tax Assessment Total Assessment is a certain percentage of the fair market value that is determined by local assessors to be the total taxable value of land and additions on the property. | Land | Improvement |
|---|---|---|---|---|
| 2025 | $3,526 | $401,507 | $150,000 | $251,507 |
| 2024 | $3,447 | $401,507 | $150,000 | $251,507 |
| 2023 | $2,596 | $234,852 | $62,000 | $172,852 |
| 2022 | $2,438 | $234,852 | $62,000 | $172,852 |
| 2021 | $2,345 | $234,852 | $62,000 | $172,852 |
| 2020 | $2,322 | $234,852 | $62,000 | $172,852 |
| 2019 | $2,100 | $183,110 | $62,000 | $121,110 |
| 2018 | $1,978 | $183,110 | $62,000 | $121,110 |
| 2017 | $1,842 | $183,110 | $62,000 | $121,110 |
| 2016 | $1,815 | $183,110 | $62,000 | $121,110 |
| 2015 | $1,685 | $165,747 | $45,000 | $120,747 |
| 2014 | $1,624 | $165,747 | $45,000 | $120,747 |
Source: Public Records
Map
Nearby Homes
- 1039 Dual Parks Rd
- 0-2932 Tingen Rd
- 335 Anterbury Dr
- 359 Anterbury Dr
- 318 Glaston Ct
- 1464 Padstone Dr
- 1023 Irongate Dr
- 1434 Salem Creek Dr
- 1614 Brussels Dr
- 1004 Marston Ct
- 1787 Flint Valley Ln
- 1840 Flint Valley Ln
- 1104 Barrow Nook Ct
- 406 S Salem St
- 410 2nd St
- 307 S Elm St
- 632 Briarcliff St
- 105 Cunningham St
- 1706 Burgundy Park Dr
- 202 W Chatham St
- 1049 Dual Parks Rd
- 1047 Dual Parks Rd
- 1103 Shackleton Rd Unit 5
- 1105 Shackleton Rd
- 1105 Shackleton Rd Unit 1&2
- 1100 Shackleton Rd
- 1045 Dual Parks Rd
- 1104 Shackleton Rd
- 1050 Dual Parks Rd
- 1024 Shackleton Rd
- 1048 Dual Park
- 1048 Dual Parks Rd
- 1052 Dual Parks Rd
- 1107 Shackleton Rd
- 1106 Shackleton Rd
- 1043 Dual Parks Rd
- 1022 Shackleton Rd
- 1044 Dual Parks Rd
- 1044 Dual Park
- 1108 Shackleton Rd