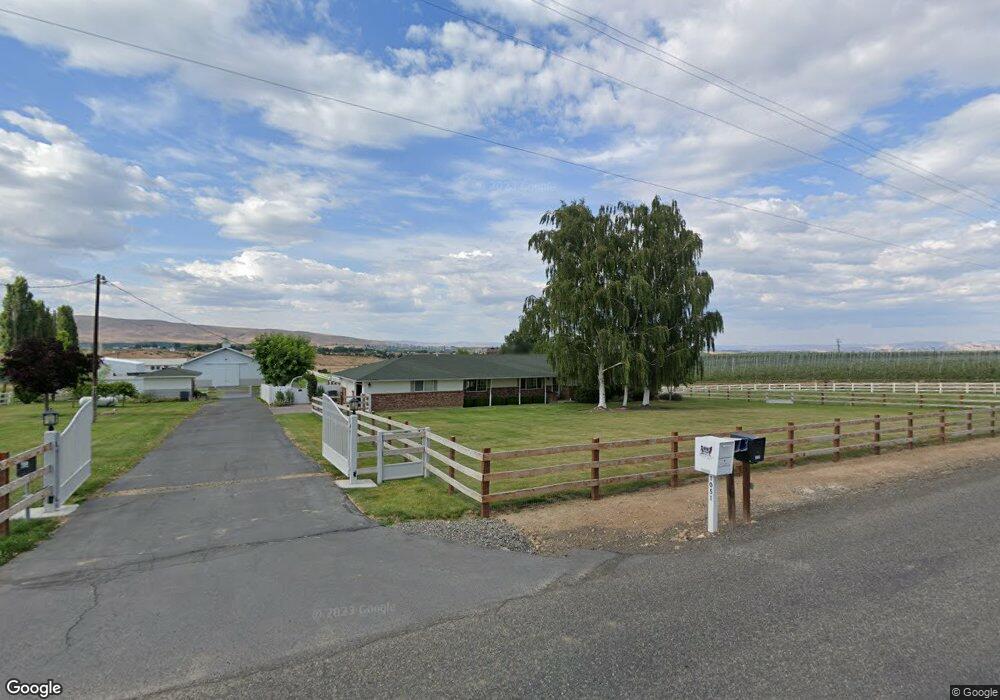
1051 Hubbard Rd Yakima, WA 98903
Estimated Value: $536,000 - $668,000
3
Beds
3
Baths
2,296
Sq Ft
$255/Sq Ft
Est. Value
About This Home
This home is located at 1051 Hubbard Rd, Yakima, WA 98903 and is currently estimated at $585,303, approximately $254 per square foot. 1051 Hubbard Rd is a home located in Yakima County with nearby schools including Ahtanum Valley Elementary School, West Valley Middle School, and West Valley High School Freshman Campus.
Ownership History
Date
Name
Owned For
Owner Type
Purchase Details
Closed on
Dec 17, 2014
Sold by
Smith Harry L and Smith Doris J
Bought by
Price Timothy A and Price Shelly L
Current Estimated Value
Home Financials for this Owner
Home Financials are based on the most recent Mortgage that was taken out on this home.
Original Mortgage
$300,000
Outstanding Balance
$230,137
Interest Rate
3.96%
Mortgage Type
New Conventional
Estimated Equity
$355,166
Purchase Details
Closed on
Aug 4, 2011
Sold by
Smith Harry L and Smith Doris J
Bought by
Smith Harry L and Smith Doris J
Purchase Details
Closed on
Oct 10, 2007
Sold by
Mseitif Walid and Mseitif Annette
Bought by
Smith Doris J and Smith Harry L
Purchase Details
Closed on
Oct 12, 2005
Sold by
Mseitif Walid and Mseitif Annette
Bought by
Mseitif Walid and Mseitif Annette
Purchase Details
Closed on
Jul 6, 2005
Sold by
Cox Billie E and Cox Lynn L
Bought by
Mseitif Walid and Mseitif Annette
Create a Home Valuation Report for This Property
The Home Valuation Report is an in-depth analysis detailing your home's value as well as a comparison with similar homes in the area
Home Values in the Area
Average Home Value in this Area
Purchase History
| Date | Buyer | Sale Price | Title Company |
|---|---|---|---|
| Price Timothy A | $382,500 | First American Title Ins Co | |
| Smith Harry L | -- | None Available | |
| Smith Doris J | $535,000 | First American Title Comp | |
| Mseitif Walid | -- | None Available | |
| Mseitif Walid | $348,118 | First American Title Comp |
Source: Public Records
Mortgage History
| Date | Status | Borrower | Loan Amount |
|---|---|---|---|
| Open | Price Timothy A | $300,000 |
Source: Public Records
Tax History Compared to Growth
Tax History
| Year | Tax Paid | Tax Assessment Tax Assessment Total Assessment is a certain percentage of the fair market value that is determined by local assessors to be the total taxable value of land and additions on the property. | Land | Improvement |
|---|---|---|---|---|
| 2025 | $5,297 | $579,100 | $89,300 | $489,800 |
| 2023 | $4,822 | $458,800 | $67,400 | $391,400 |
| 2022 | $4,526 | $414,000 | $64,600 | $349,400 |
| 2021 | $4,138 | $375,800 | $62,200 | $313,600 |
| 2019 | $3,347 | $303,200 | $57,800 | $245,400 |
| 2018 | $3,756 | $290,700 | $46,900 | $243,800 |
| 2017 | $3,587 | $292,400 | $46,900 | $245,500 |
| 2016 | $4,087 | $296,000 | $47,900 | $248,100 |
| 2015 | $4,087 | $295,800 | $47,900 | $247,900 |
| 2014 | $4,087 | $299,100 | $47,900 | $251,200 |
| 2013 | $4,087 | $299,100 | $47,900 | $251,200 |
Source: Public Records
Map
Nearby Homes
- 15083 Cottonwood Canyon Rd
- NNA Cottonwood Canyon Rd
- NKA Cottonwood Canyon Rd
- 15783 Fisk Rd
- 3134 Stone Rd
- 2889 Stone Rd
- 14530 Rutherford Rd
- 1410 Stone Rd
- 1730 N Cottonwood Rd
- NKA Douglas Rd
- 14530 W Rutherford Rd
- 2605 Nelson Rd
- 790 Cook Rd
- 12312 Nelson Rd
- 283 Cook Rd
- 12900 Douglas Rd
- 1465 Cook Rd
- 12907 Douglas Rd
- 12826 Douglas Rd
- 1355 Cook Rd
- 1051 Hubbard Rd
- 1050 Hubbard Rd
- 1211 Hubbard Rd
- 1271 Hubbard Rd
- NKA Hubbard Rd
- 15200 Cottonwood Canyon Rd
- 15180 Cottonwood Canyon Rd
- 15170 Cottonwood Canyon Rd
- 15170 Cottonwood Canyon Rd
- 15000 Cottonwood Canyon Rd
- 1411 Hubbard Rd
- 15552 Cottonwood Canyon Rd
- 15310 Cottonwood Canyon Rd
- 15531 Cottonwood Canyon Rd
- 15151 Cottonwood Canyon Rd
- 15151 Cottonwood Canyon Rd
- 1521 Hubbard Rd
- 415 Richartz Rd
- 15550 Cottonwood Canyon Rd
- 2070 Hubbard Rd