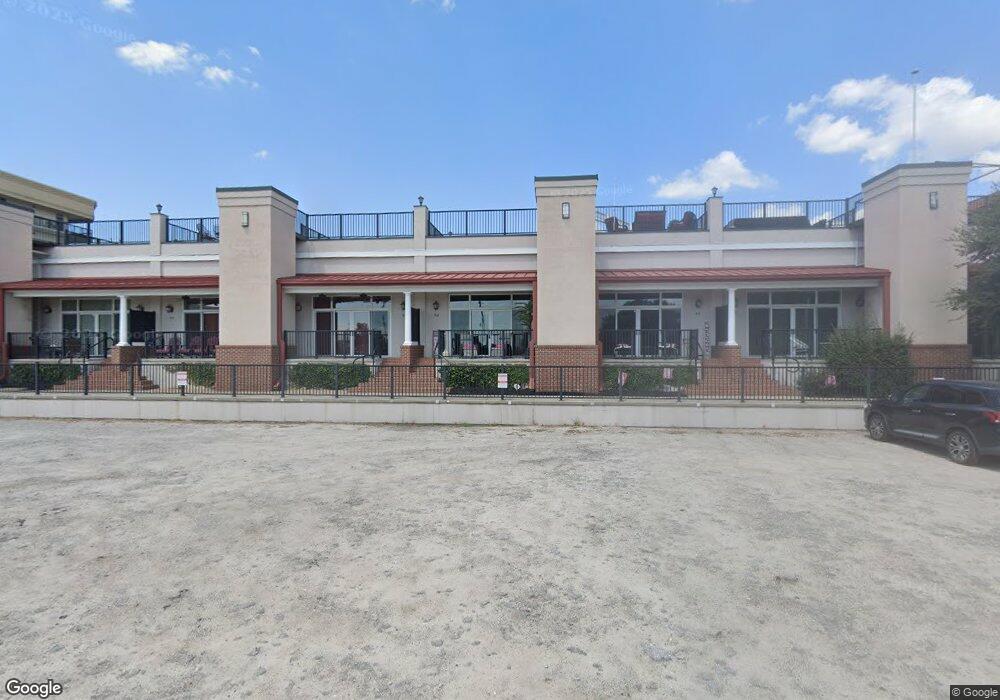
1051 Key Rd Unit 6 Columbia, SC 29201
Arthurtown NeighborhoodEstimated Value: $358,000 - $485,585
2
Beds
2
Baths
1,100
Sq Ft
$385/Sq Ft
Est. Value
About This Home
This home is located at 1051 Key Rd Unit 6, Columbia, SC 29201 and is currently estimated at $423,146, approximately $384 per square foot. 1051 Key Rd Unit 6 is a home located in Richland County with nearby schools including Rosewood Elementary School, Hand Middle School, and Dreher High School.
Ownership History
Date
Name
Owned For
Owner Type
Purchase Details
Closed on
Oct 2, 2023
Sold by
Wrenn Clyde W
Bought by
Mckay Jennifer Brown
Current Estimated Value
Purchase Details
Closed on
Aug 27, 2021
Sold by
Johnson Lisa S and Johnson Jeffrey W
Bought by
Wrenn Clyde W
Home Financials for this Owner
Home Financials are based on the most recent Mortgage that was taken out on this home.
Original Mortgage
$130,000
Interest Rate
2.2%
Mortgage Type
New Conventional
Purchase Details
Closed on
Jul 27, 2019
Sold by
Farnham Jeff and Farnham Sharon
Bought by
Johnson Lisa S and Johnson Jeffrey W
Purchase Details
Closed on
Dec 30, 2013
Sold by
Farnham Enterprises 6 Llc
Bought by
Farnham Karli and Farnham Jeff
Purchase Details
Closed on
Dec 31, 2012
Sold by
Thompson Property Management Llc
Bought by
Farnham Enterprises 6 Llc
Purchase Details
Closed on
Jun 29, 2011
Sold by
Market Center One Llc
Bought by
Thompson Property Management Llc
Create a Home Valuation Report for This Property
The Home Valuation Report is an in-depth analysis detailing your home's value as well as a comparison with similar homes in the area
Home Values in the Area
Average Home Value in this Area
Purchase History
| Date | Buyer | Sale Price | Title Company |
|---|---|---|---|
| Mckay Jennifer Brown | $425,000 | South Carolina Title | |
| Wrenn Clyde W | $225,000 | None Available | |
| Johnson Lisa S | $185,000 | None Available | |
| Farnham Karli | -- | None Available | |
| Farnham Enterprises 6 Llc | $150,000 | None Available | |
| Thompson Property Management Llc | $1,179,500 | -- |
Source: Public Records
Mortgage History
| Date | Status | Borrower | Loan Amount |
|---|---|---|---|
| Previous Owner | Wrenn Clyde W | $130,000 |
Source: Public Records
Tax History
| Year | Tax Paid | Tax Assessment Tax Assessment Total Assessment is a certain percentage of the fair market value that is determined by local assessors to be the total taxable value of land and additions on the property. | Land | Improvement |
|---|---|---|---|---|
| 2024 | $11,871 | $425,000 | $13,700 | $411,300 |
| 2023 | $11,630 | $9,000 | $0 | $0 |
| 2022 | $6,506 | $225,000 | $7,500 | $217,500 |
| 2021 | $5,393 | $11,100 | $0 | $0 |
| 2020 | $5,469 | $11,100 | $0 | $0 |
| 2019 | $3,488 | $7,060 | $0 | $0 |
| 2018 | $4,676 | $9,350 | $0 | $0 |
| 2017 | $4,547 | $9,350 | $0 | $0 |
| 2016 | $4,422 | $9,350 | $0 | $0 |
| 2015 | $4,395 | $9,350 | $0 | $0 |
| 2014 | $4,356 | $155,900 | $0 | $0 |
| 2013 | -- | $9,350 | $0 | $0 |
Source: Public Records
Map
Nearby Homes
- 1200 Bluff Rd
- 1200 Bluff Rd Unit 14
- 1085 Shop Rd Unit 434
- 1085 Shop Rd Unit 145
- 1085 Shop Rd Unit 342
- 1215 Bluff Rd
- 900 S Stadium Rd Unit S312
- 1115 Bluff Industrial Blvd
- 1001 S Stadium Rd Unit 17
- 2212 Kingswood Dr
- 33 Kingsgate Dr
- 340 S Bull St
- 535 Virginia St
- 803 Howard St
- 850 Ohio St
- 979 Airport Blvd
- 305 S Saluda Ave
- 1213 Walcott St
- 1218 Walcott St
- 2218 Rosewood Dr
- 1051 Key Rd Unit 7
- 1051 Key Rd
- 1051 Key Rd Unit 21
- 1051 Key Rd Unit 9
- 1051 Key Rd Unit 2
- 1051 Key Rd Unit 10
- 1051 Key Rd Unit 11
- 1051 Key Rd Unit 14
- 1051 Key Rd Unit 56
- 1051 Key Rd Unit 46
- 1051 Key Rd Unit 12
- 1051 Key Rd Unit 32
- 1051 Key Rd Unit 29
- 1051 Key Rd Unit 53
- 1051 Key Rd Unit 30
- 1051 Key Rd Unit 52
- 1051 Key Rd Unit 28
- 1051 Key Rd Unit 26
- 1051 Key Rd Unit 38
- 1051 Key Rd Unit 48
Your Personal Tour Guide
Ask me questions while you tour the home.