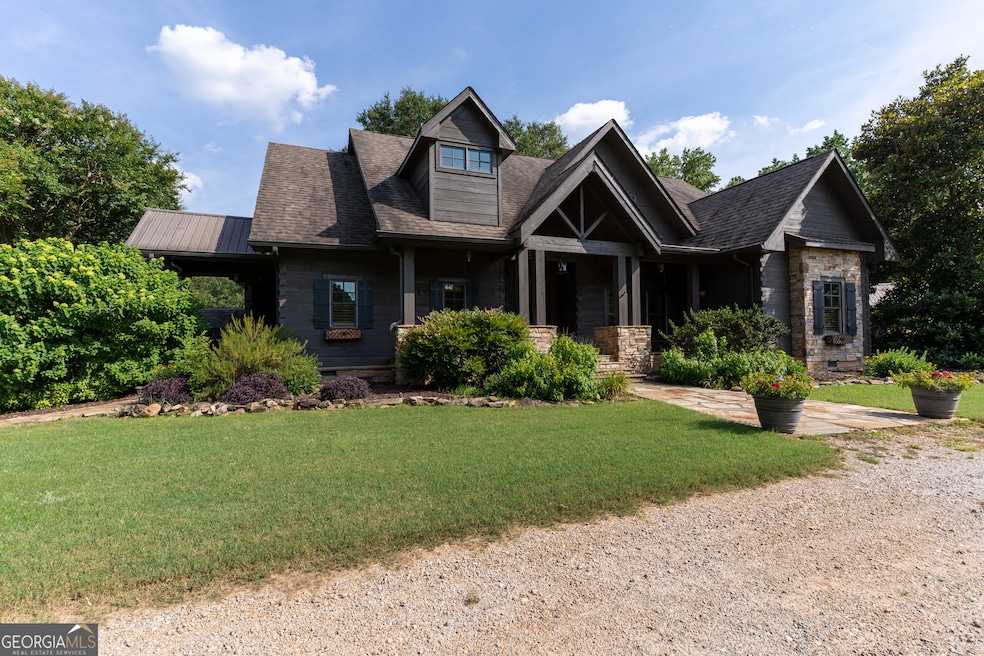
1051 Lake Rutledge Rd Rutledge, GA 30663
Estimated payment $7,064/month
Highlights
- Barn
- In Ground Pool
- Second Garage
- Morgan County Primary School Rated A-
- Home fronts a pond
- Lake View
About This Home
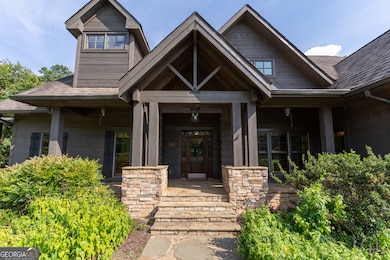
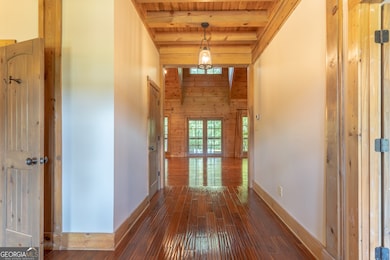
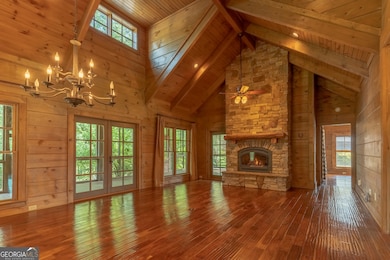
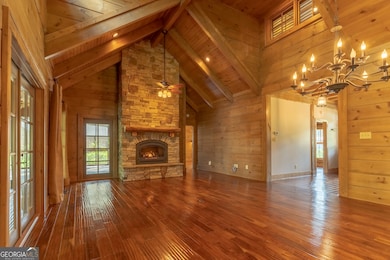
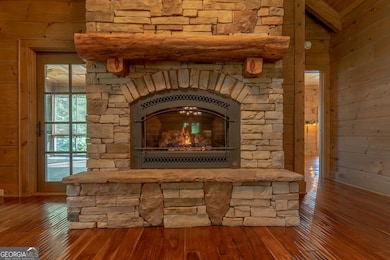
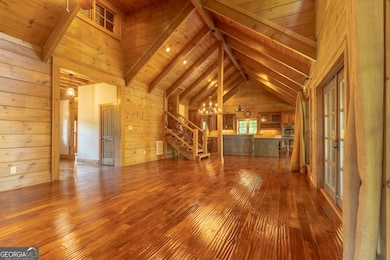
Imagine waking up to the gentle nickering of horses and the serene beauty of lake views, all from your own slice of paradise. Nestled on 13 sprawling acres in the heart of Rutledge, Georgia, this exquisite horse farm offers the perfect blend of luxury, functionality, and countryside charm. Built in 2005, this move-in-ready estate is a rare opportunity for equestrian enthusiasts and families seeking space and tranquility. Step inside and feel instantly at home with a main-level master retreat, two gas fireplaces adding warmth, gleaming hardwood floors throughout, and high ceilings creating an airy ambiance. The large kitchen, equipped with stainless steel appliances, is a chef's delight-ideal for meals after a day with the horses or hosting friends by the pool. The home's thoughtful construction includes spray foam insulation in the attic, ensuring year-round comfort and energy efficiency, perfectly complementing the open, inviting feel of the space. This property is a horse lover's dream with fenced and cross-fenced pastures ready for grazing, a detached 3-car garage with a car lift for car enthusiasts, a dedicated feed and tack room for organization, plus an additional detached 2-car garage and spacious pole barn for endless storage and workspace. With 13 acres, the possibilities for expansion or personalization are boundless. Dive into relaxation with the in-ground saltwater pool, perfectly positioned to enjoy the natural beauty of the estate, while a stocked fishing pond adds recreational appeal, making this property a year-round retreat. Located in the Morgan County School District, this estate is just seconds from Hard Labor Creek State Park, offering hiking, horseback riding, and golfing, and a short drive from the charming Historic Downtown Madison. Picture yourself riding through the pastures, unwinding by the pool, or gathering around the fireplace-this isn't just a home; it's a lifestyle waiting for you to claim. Schedule a tour today and experience the magic of 1051 Lake Rutledge Rd for yourself!
Home Details
Home Type
- Single Family
Est. Annual Taxes
- $5,862
Year Built
- Built in 2005
Lot Details
- 13.19 Acre Lot
- Home fronts a pond
- Property borders a national or state park
- Back and Front Yard Fenced
- Private Lot
- Open Lot
- Cleared Lot
- Partially Wooded Lot
- Garden
- Grass Covered Lot
Home Design
- Craftsman Architecture
- Pillar, Post or Pier Foundation
- Block Foundation
- Composition Roof
- Metal Roof
- Rough-Sawn Siding
- Concrete Siding
- Block Exterior
- Stone Siding
- Log Siding
- Stone
Interior Spaces
- 3,696 Sq Ft Home
- 2-Story Property
- Beamed Ceilings
- Vaulted Ceiling
- Skylights
- Gas Log Fireplace
- Double Pane Windows
- Entrance Foyer
- Great Room
- Living Room with Fireplace
- 2 Fireplaces
- Home Office
- Loft
- Screened Porch
- Lake Views
- Crawl Space
Kitchen
- Country Kitchen
- Breakfast Area or Nook
- Breakfast Bar
- Walk-In Pantry
- Built-In Double Oven
- Cooktop
- Microwave
- Ice Maker
- Dishwasher
- Stainless Steel Appliances
- Kitchen Island
- Solid Surface Countertops
Flooring
- Wood
- Carpet
- Tile
Bedrooms and Bathrooms
- 3 Bedrooms | 2 Main Level Bedrooms
- Primary Bedroom on Main
- Walk-In Closet
- Double Vanity
- Whirlpool Bathtub
- Bathtub Includes Tile Surround
- Separate Shower
Laundry
- Laundry Room
- Laundry in Hall
Parking
- 10 Car Garage
- Second Garage
- Parking Pad
- Side or Rear Entrance to Parking
Pool
- In Ground Pool
- Saltwater Pool
Outdoor Features
- Deck
- Patio
- Outdoor Fireplace
- Separate Outdoor Workshop
- Shed
- Outbuilding
Schools
- Morgan County Primary/Elementa Elementary School
- Morgan County Middle School
- Morgan County High School
Farming
- Barn
- Pasture
Utilities
- Central Heating and Cooling System
- Heating System Uses Propane
- Well
- Septic Tank
- High Speed Internet
- Cable TV Available
Community Details
- No Home Owners Association
- Laundry Facilities
Map
Home Values in the Area
Average Home Value in this Area
Tax History
| Year | Tax Paid | Tax Assessment Tax Assessment Total Assessment is a certain percentage of the fair market value that is determined by local assessors to be the total taxable value of land and additions on the property. | Land | Improvement |
|---|---|---|---|---|
| 2024 | $5,464 | $257,273 | $48,248 | $209,025 |
| 2023 | $4,873 | $224,810 | $37,040 | $187,770 |
| 2022 | $4,834 | $215,034 | $37,040 | $177,994 |
| 2021 | $4,854 | $215,034 | $37,040 | $177,994 |
| 2020 | $4,892 | $214,733 | $37,040 | $177,693 |
| 2019 | $4,925 | $212,892 | $37,040 | $175,852 |
| 2018 | $4,533 | $194,694 | $34,682 | $160,012 |
| 2017 | $5,068 | $195,623 | $34,682 | $160,941 |
| 2016 | $4,238 | $177,642 | $32,841 | $144,801 |
| 2015 | $4,310 | $178,560 | $30,080 | $148,480 |
| 2014 | $3,627 | $157,400 | $27,920 | $129,480 |
| 2013 | -- | $126,120 | $41,240 | $84,880 |
Property History
| Date | Event | Price | List to Sale | Price per Sq Ft |
|---|---|---|---|---|
| 06/27/2025 06/27/25 | For Sale | $1,250,000 | -- | $338 / Sq Ft |
Purchase History
| Date | Type | Sale Price | Title Company |
|---|---|---|---|
| Warranty Deed | $1,250,000 | -- | |
| Warranty Deed | -- | -- | |
| Deed | $21,794 | -- | |
| Interfamily Deed Transfer | -- | -- | |
| Deed | -- | -- |
Source: Georgia MLS
MLS Number: 10552349
APN: 01102700A
Disclaimer: Certain information contained herein is derived from information provided by parties other than Homes.com. All information provided is deemed reliable, but is not guaranteed to be accurate and should be independently verified.
![]() The data relating to real estate for sale on this web site comes in part from the Broker Reciprocity Program of Georgia MLS. Real estate listings held by brokerage firms other than Redfin are marked with the Broker Reciprocity logo and detailed information about them includes the name of the listing brokers. Information deemed reliable but not guaranteed. Copyright 2025 Georgia MLS. All rights reserved.
The data relating to real estate for sale on this web site comes in part from the Broker Reciprocity Program of Georgia MLS. Real estate listings held by brokerage firms other than Redfin are marked with the Broker Reciprocity logo and detailed information about them includes the name of the listing brokers. Information deemed reliable but not guaranteed. Copyright 2025 Georgia MLS. All rights reserved.
- 0 Fairplay St Unit 10637174
- 224 Hollis St
- 0 W Dixie Hwy Unit 10499573
- 120 Hidden Falls Ct
- 0 Reese Rd Unit 10622381
- 294 Tuscany Dr
- 0 Hawkins Academy Rd Unit 10561655
- 5761 W Dixie Hwy
- 5521 Atlanta Hwy
- 1971 Centennial Rd
- 1151 Fears Rd
- 2070 Walter Shepherd Rd
- 1310 Chilton Woods Rd
- 1310 Deerwood Dr
- 5187 Parkview Rd
- 105 Knox Chapel Rd
- 175 E Main St Unit B
- 1121 Prospect Rd Unit A
- 1540 Lipscomb Rd
- 764 Dove Tree Ln
- 303 Dove Point
- 1571 Bostwick Rd
- 685 Meadows Ln
- 1020 Joseph Ln
- 253 Marco Dr
- 1181 Commerce St
- 1015 Highland Ave
- 205 N Second St
- 363 E Jefferson St
- 615 Harris St
- 1071 Bramblewood Dr Unit B
- 1071 Bramblewood Dr Unit A
- 1000 Pine Tree Cir
- 1101 Overlook Dr
- 20 Willow Woods Rd
- 21 Willow Woods Rd
