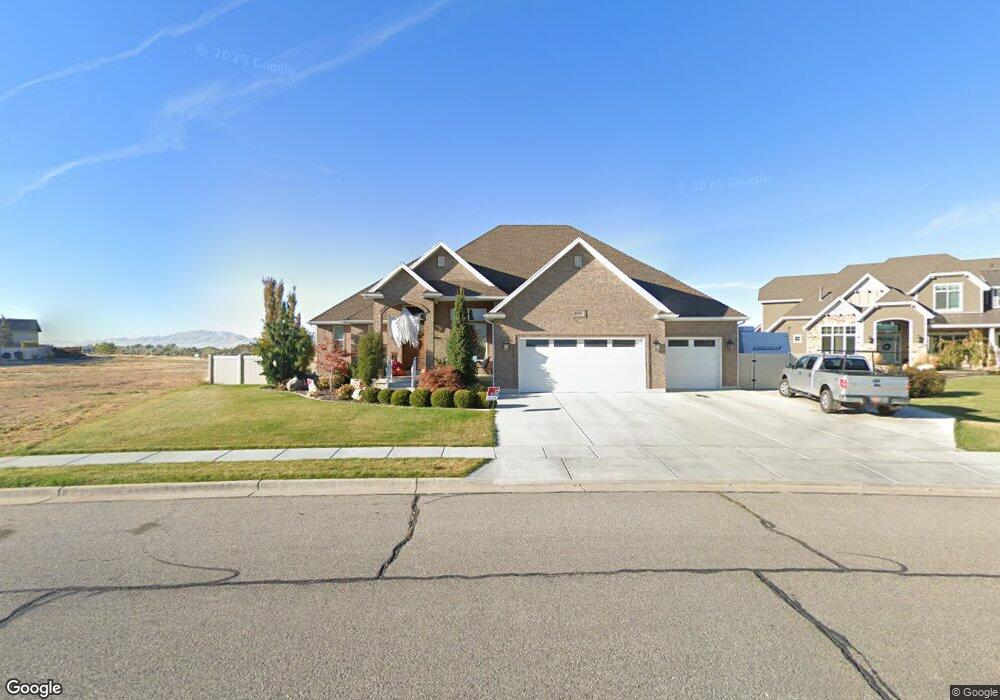
1051 N 4150 W West Point, UT 84015
Estimated Value: $695,000 - $867,000
2
Beds
3
Baths
4,000
Sq Ft
$192/Sq Ft
Est. Value
About This Home
This home is located at 1051 N 4150 W, West Point, UT 84015 and is currently estimated at $769,128, approximately $192 per square foot. 1051 N 4150 W is a home located in Davis County with nearby schools including West Point School, West Point Junior High School, and Syracuse High School.
Ownership History
Date
Name
Owned For
Owner Type
Purchase Details
Closed on
Sep 3, 2021
Sold by
Blakeley Jacqueline and Blakeley Dustin
Bought by
Blakeley Dustin and Blakeley Jacqueline
Current Estimated Value
Home Financials for this Owner
Home Financials are based on the most recent Mortgage that was taken out on this home.
Original Mortgage
$486,000
Outstanding Balance
$441,259
Interest Rate
2.8%
Mortgage Type
New Conventional
Estimated Equity
$327,869
Purchase Details
Closed on
Feb 25, 2015
Sold by
Stoddard Howard F and Stoddard Annabeth G
Bought by
Paz M Teresa
Purchase Details
Closed on
Jan 9, 2008
Sold by
Craythorne Development Inc
Bought by
Stoddard Howard F and Stoddard Annabeth G
Purchase Details
Closed on
Jan 4, 2007
Sold by
Kirkman Farms Llc
Bought by
Craythorne Development Inc
Create a Home Valuation Report for This Property
The Home Valuation Report is an in-depth analysis detailing your home's value as well as a comparison with similar homes in the area
Home Values in the Area
Average Home Value in this Area
Purchase History
| Date | Buyer | Sale Price | Title Company |
|---|---|---|---|
| Blakeley Dustin | -- | Us Title Company Of Utah | |
| Paz M Teresa | -- | None Available | |
| Stoddard Howard F | -- | Bonneville Superior Title Co | |
| Craythorne Development Inc | -- | Bonneville Superior Title Co |
Source: Public Records
Mortgage History
| Date | Status | Borrower | Loan Amount |
|---|---|---|---|
| Open | Blakeley Dustin | $486,000 |
Source: Public Records
Tax History Compared to Growth
Tax History
| Year | Tax Paid | Tax Assessment Tax Assessment Total Assessment is a certain percentage of the fair market value that is determined by local assessors to be the total taxable value of land and additions on the property. | Land | Improvement |
|---|---|---|---|---|
| 2025 | $4,091 | $383,351 | $145,613 | $237,738 |
| 2024 | $3,956 | $372,350 | $130,904 | $241,446 |
| 2023 | $3,534 | $612,000 | $175,005 | $436,995 |
| 2022 | $3,894 | $369,050 | $94,513 | $274,537 |
| 2021 | $3,639 | $516,000 | $134,544 | $381,456 |
| 2020 | $3,388 | $474,000 | $115,336 | $358,664 |
| 2019 | $3,298 | $455,000 | $111,206 | $343,794 |
| 2018 | $3,111 | $423,000 | $106,234 | $316,766 |
| 2016 | $1,675 | $119,859 | $41,319 | $78,540 |
| 2015 | $1,108 | $75,125 | $75,125 | $0 |
| 2014 | $1,093 | $75,125 | $75,125 | $0 |
| 2013 | -- | $46,056 | $46,056 | $0 |
Source: Public Records
Map
Nearby Homes
- 4469 W 1000 N Unit 120
- 4061 W 1250 N Unit 1250
- 3932 W 825 N Unit WF5
- 3918 W 825 N Unit WF6
- 3892 W 1450 N
- 4302 W 1550 N
- 1717 N 4325 W
- 477 N 4500 W
- 357 N 4000 W
- 1635 N 4625 W
- 4719 W 650 N
- 4352 W 300 N
- Charleston Plan at Bluff View
- 4366 W 200 N
- 120 N 4325 W
- 399 N 3425 W
- 4362 West St Unit 106
- 4358 West St Unit 105
- 2084 N 4500 W
- 3168 W 1300 N