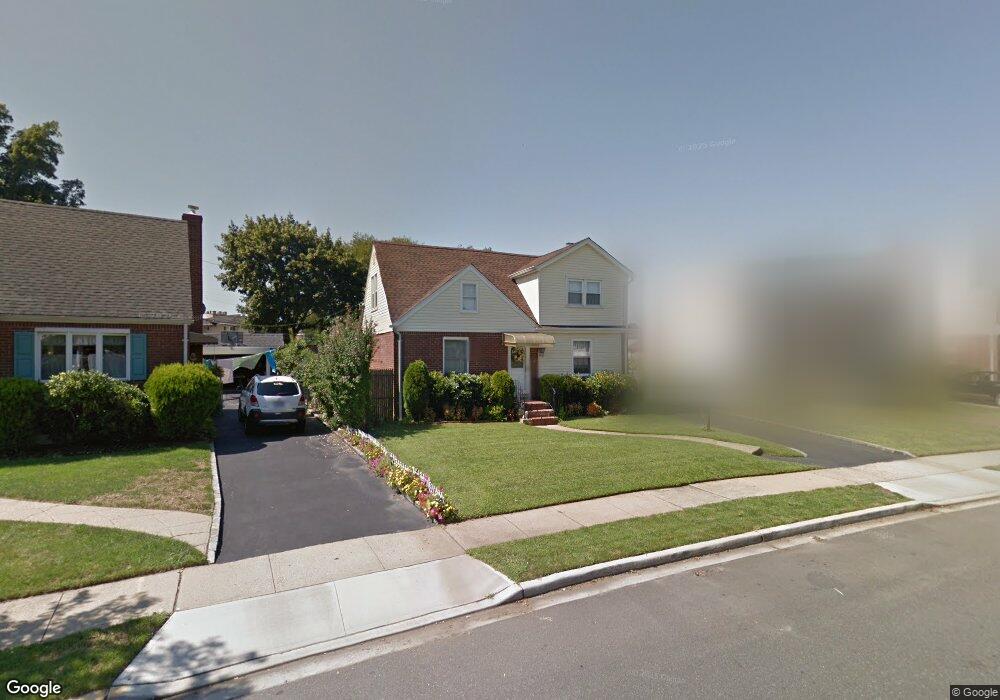
1051 Oaks Dr Franklin Square, NY 11010
Estimated Value: $798,000 - $830,120
--
Bed
2
Baths
1,724
Sq Ft
$472/Sq Ft
Est. Value
About This Home
This home is located at 1051 Oaks Dr, Franklin Square, NY 11010 and is currently estimated at $814,060, approximately $472 per square foot. 1051 Oaks Dr is a home located in Nassau County with nearby schools including Cheder at the Ohel.
Ownership History
Date
Name
Owned For
Owner Type
Purchase Details
Closed on
Dec 14, 2021
Sold by
Pisciotta Thomas J and Pisciotta Anna
Bought by
Pisciotta Trust
Current Estimated Value
Purchase Details
Closed on
Jan 11, 2006
Sold by
Calahan David
Bought by
Pisciotta Thomas
Purchase Details
Closed on
Sep 29, 2004
Sold by
Callahan Patricia
Purchase Details
Closed on
Dec 27, 2000
Purchase Details
Closed on
Nov 19, 1999
Sold by
Kaczorowski Charles and Kazcorowski Michelle Locke
Bought by
Palmaccio John and Haap Patricia
Home Financials for this Owner
Home Financials are based on the most recent Mortgage that was taken out on this home.
Original Mortgage
$180,000
Interest Rate
7.86%
Mortgage Type
Purchase Money Mortgage
Purchase Details
Closed on
Mar 25, 1996
Sold by
Dolch Robert and Dolch Maria
Bought by
Kaczorowski Charles and Kaczorowski Michele
Home Financials for this Owner
Home Financials are based on the most recent Mortgage that was taken out on this home.
Original Mortgage
$195,300
Interest Rate
7.31%
Create a Home Valuation Report for This Property
The Home Valuation Report is an in-depth analysis detailing your home's value as well as a comparison with similar homes in the area
Home Values in the Area
Average Home Value in this Area
Purchase History
| Date | Buyer | Sale Price | Title Company |
|---|---|---|---|
| Pisciotta Trust | -- | None Available | |
| Pisciotta Thomas | $530,000 | -- | |
| -- | -- | -- | |
| -- | -- | -- | |
| Palmaccio John | $277,000 | Old Republic Natl Title Ins | |
| Kaczorowski Charles | $217,000 | -- |
Source: Public Records
Mortgage History
| Date | Status | Borrower | Loan Amount |
|---|---|---|---|
| Previous Owner | Palmaccio John | $180,000 | |
| Previous Owner | Kaczorowski Charles | $195,300 |
Source: Public Records
Tax History Compared to Growth
Tax History
| Year | Tax Paid | Tax Assessment Tax Assessment Total Assessment is a certain percentage of the fair market value that is determined by local assessors to be the total taxable value of land and additions on the property. | Land | Improvement |
|---|---|---|---|---|
| 2025 | $13,621 | $651 | $380 | $271 |
| 2024 | $5,565 | $615 | $356 | $259 |
| 2023 | $12,982 | $609 | $353 | $256 |
| 2022 | $12,982 | $656 | $380 | $276 |
| 2021 | $19,411 | $644 | $373 | $271 |
| 2020 | $17,056 | $1,158 | $630 | $528 |
| 2019 | $6,523 | $1,158 | $630 | $528 |
| 2018 | $6,229 | $1,158 | $0 | $0 |
| 2017 | $8,599 | $1,158 | $630 | $528 |
| 2016 | $14,562 | $1,158 | $630 | $528 |
| 2015 | $5,542 | $1,158 | $630 | $528 |
| 2014 | $5,542 | $1,158 | $630 | $528 |
| 2013 | $5,173 | $1,158 | $630 | $528 |
Source: Public Records
Map
Nearby Homes
- 1035 Glen Dr
- 997 Glen Dr
- 1007 Third Ave
- 1053 Lorraine Dr
- 422 Saint Agnes Place
- 911 First Ave
- 1022 Jackson Ave
- 865 Third Ave
- 850 First Ave
- 1047 Windermere Rd
- 6 Nelson St
- 291 Lincoln St
- 1048 Windermere Rd
- 342 Lucille Ave
- 993 Ferngate Dr
- 956 Hancock Ave
- 1260 Bretton Rd
- 389 Hunnewell Ave
- 298 Doris Ave
- 280 Franklin Ave Unit 11