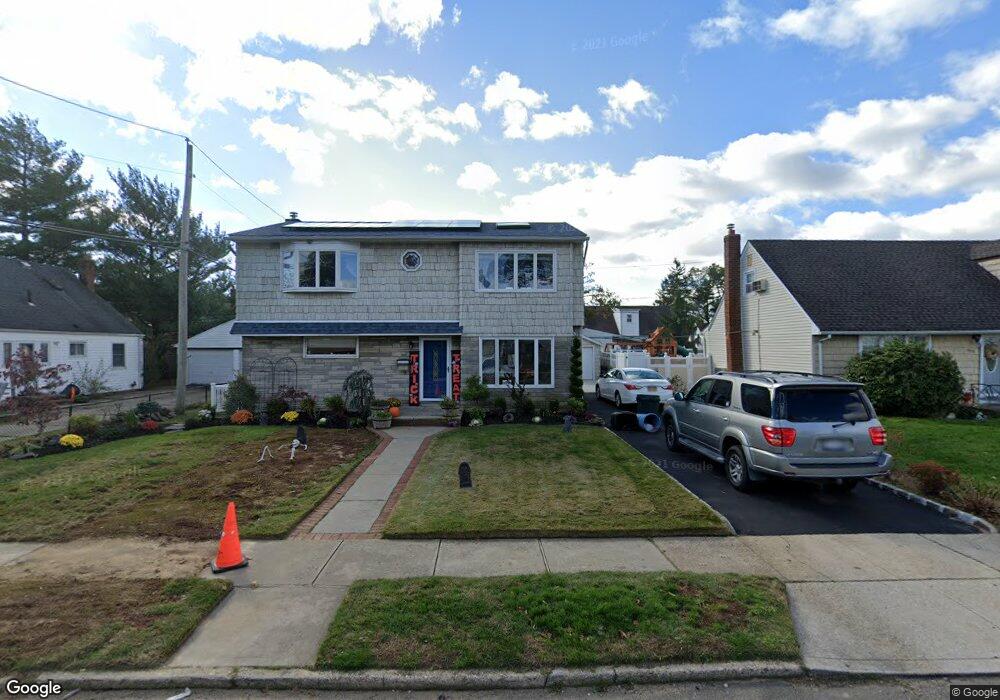
1051 Park Ln N Franklin Square, NY 11010
Estimated Value: $894,000 - $986,442
5
Beds
1
Bath
2,172
Sq Ft
$433/Sq Ft
Est. Value
About This Home
This home is located at 1051 Park Ln N, Franklin Square, NY 11010 and is currently estimated at $940,221, approximately $432 per square foot. 1051 Park Ln N is a home located in Nassau County with nearby schools including Cheder at the Ohel.
Ownership History
Date
Name
Owned For
Owner Type
Purchase Details
Closed on
Mar 31, 2017
Sold by
Manufacturers & Traders Trust Company and M & T Bank
Bought by
Jump Zachary and Curatolo Kristina
Current Estimated Value
Home Financials for this Owner
Home Financials are based on the most recent Mortgage that was taken out on this home.
Original Mortgage
$393,600
Outstanding Balance
$325,519
Interest Rate
4.16%
Mortgage Type
New Conventional
Estimated Equity
$614,702
Purchase Details
Closed on
Apr 8, 2016
Sold by
Referee Of Nassau County and Ricciardi Esq
Bought by
Manufacturers & Traders Trust Company and M & T Bank
Purchase Details
Closed on
Oct 7, 2005
Sold by
Lueckheide June
Bought by
Prisco Vincent
Create a Home Valuation Report for This Property
The Home Valuation Report is an in-depth analysis detailing your home's value as well as a comparison with similar homes in the area
Home Values in the Area
Average Home Value in this Area
Purchase History
| Date | Buyer | Sale Price | Title Company |
|---|---|---|---|
| Jump Zachary | $491,150 | Chicago Title Insurance Comp | |
| Jump Zachary | $491,150 | Chicago Title Insurance Comp | |
| Jump Zachary | $491,150 | Chicago Title Insurance Comp | |
| Manufacturers & Traders Trust Company | $784,154 | None Available | |
| Manufacturers & Traders Trust Company | $784,154 | None Available | |
| Manufacturers & Traders Trust Company | $784,154 | None Available | |
| Prisco Vincent | $550,000 | -- | |
| Prisco Vincent | $550,000 | -- |
Source: Public Records
Mortgage History
| Date | Status | Borrower | Loan Amount |
|---|---|---|---|
| Open | Jump Zachary | $393,600 | |
| Closed | Jump Zachary | $393,600 | |
| Closed | Manufacturers & Traders Trust Company | $0 |
Source: Public Records
Tax History Compared to Growth
Tax History
| Year | Tax Paid | Tax Assessment Tax Assessment Total Assessment is a certain percentage of the fair market value that is determined by local assessors to be the total taxable value of land and additions on the property. | Land | Improvement |
|---|---|---|---|---|
| 2025 | $16,625 | $669 | $221 | $448 |
| 2024 | $6,042 | $669 | $221 | $448 |
| 2023 | $16,823 | $669 | $221 | $448 |
| 2022 | $17,519 | $669 | $221 | $448 |
| 2021 | $18,496 | $641 | $212 | $429 |
| 2020 | $19,381 | $1,117 | $532 | $585 |
| 2019 | $6,333 | $1,117 | $532 | $585 |
| 2018 | $6,106 | $1,117 | $0 | $0 |
| 2017 | $10,474 | $1,065 | $532 | $533 |
| 2016 | $16,050 | $1,065 | $532 | $533 |
| 2015 | $5,205 | $1,065 | $532 | $533 |
| 2014 | $5,205 | $1,065 | $532 | $533 |
| 2013 | $4,877 | $1,065 | $532 | $533 |
Source: Public Records
Map
Nearby Homes
- 1047 Windermere Rd
- 1048 Windermere Rd
- 1027 Windermere Rd
- 993 Ferngate Dr
- 1053 Lorraine Dr
- 1007 Third Ave
- 865 Third Ave
- 1096 Shelburne Dr
- 911 First Ave
- 1115 Agnes Ct
- 816 Anderson Ave
- 850 First Ave
- 997 Glen Dr
- 1035 Glen Dr
- 1260 Bretton Rd
- 859 Franklin Ave
- 422 Saint Agnes Place
- 807 Cypress Dr
- 818 Palmetto Dr
- 708 Anderson Ave
- 1057 Park Ln N
- 1052 Harrow Rd
- 1063 Park Ln N
- 1041 Windermere Rd
- 1058 Harrow Rd
- 1052 Park Ln N
- 1046 Park Ln N
- 1064 Harrow Rd
- 641 Arley Rd
- 1040 Park Ln N
- 1069 Park Ln N
- 1034 Park Ln N
- 1040 Windermere Rd
- 1070 Harrow Rd
- 629 Arley Rd
- 1075 Park Ln N
- 640 Arley Rd
- 1047 Ferngate Dr
- 1051 Harrow Rd
- 1041 Ferngate Dr