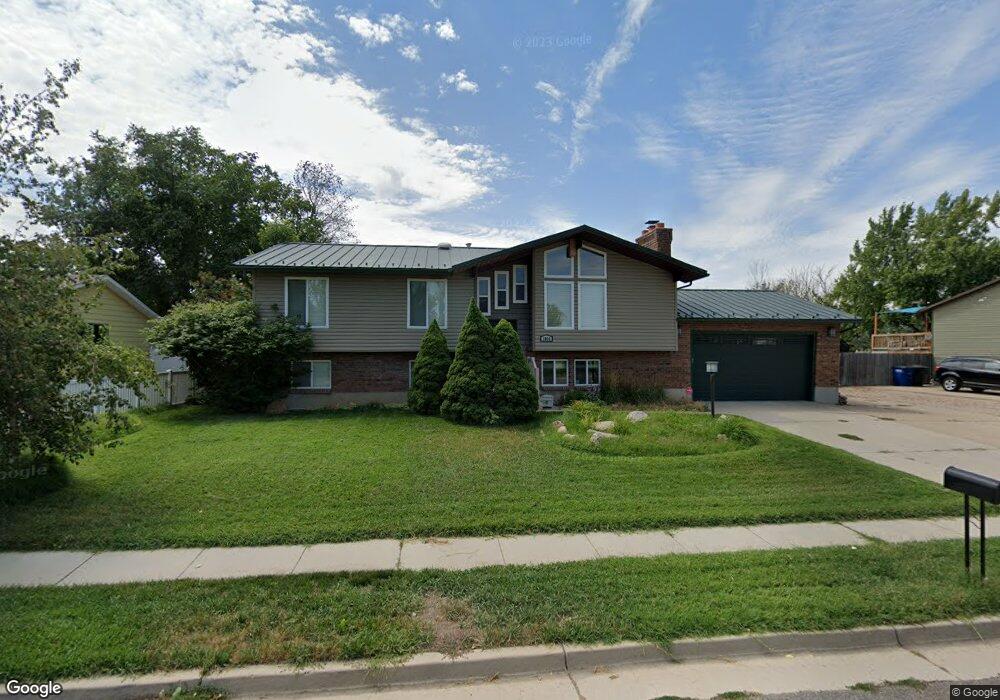
1051 W 950 N Clearfield, UT 84015
Estimated Value: $460,000 - $517,000
5
Beds
3
Baths
1,222
Sq Ft
$399/Sq Ft
Est. Value
About This Home
This home is located at 1051 W 950 N, Clearfield, UT 84015 and is currently estimated at $487,438, approximately $398 per square foot. 1051 W 950 N is a home located in Davis County with nearby schools including Clinton Elementary School, Sunset Junior High School, and Clearfield High School.
Ownership History
Date
Name
Owned For
Owner Type
Purchase Details
Closed on
Dec 8, 2011
Sold by
Purvis Charles L and Young Robin A
Bought by
Purvis Charles L and Purvis Robin A
Current Estimated Value
Home Financials for this Owner
Home Financials are based on the most recent Mortgage that was taken out on this home.
Original Mortgage
$123,151
Outstanding Balance
$85,383
Interest Rate
4.37%
Mortgage Type
FHA
Estimated Equity
$402,055
Purchase Details
Closed on
Oct 17, 2003
Sold by
Prudential Relocation Inc
Bought by
Purvis Charles L and Young Robin A
Home Financials for this Owner
Home Financials are based on the most recent Mortgage that was taken out on this home.
Original Mortgage
$139,806
Interest Rate
6.4%
Mortgage Type
FHA
Purchase Details
Closed on
May 14, 2003
Sold by
Stokes G Bruce and Stokes Elsa L
Bought by
Prudential Relocation Inc and Citicapital Relocation Inc
Create a Home Valuation Report for This Property
The Home Valuation Report is an in-depth analysis detailing your home's value as well as a comparison with similar homes in the area
Home Values in the Area
Average Home Value in this Area
Purchase History
| Date | Buyer | Sale Price | Title Company |
|---|---|---|---|
| Purvis Charles L | -- | Security Title Of Davis Cnty | |
| Purvis Charles L | -- | Equity Title Agency | |
| Prudential Relocation Inc | -- | Equity Title Agency |
Source: Public Records
Mortgage History
| Date | Status | Borrower | Loan Amount |
|---|---|---|---|
| Open | Purvis Charles L | $123,151 | |
| Closed | Purvis Charles L | $139,806 |
Source: Public Records
Tax History Compared to Growth
Tax History
| Year | Tax Paid | Tax Assessment Tax Assessment Total Assessment is a certain percentage of the fair market value that is determined by local assessors to be the total taxable value of land and additions on the property. | Land | Improvement |
|---|---|---|---|---|
| 2025 | $2,688 | $258,500 | $93,812 | $164,688 |
| 2024 | $2,583 | $249,700 | $102,757 | $146,943 |
| 2023 | $2,404 | $430,000 | $117,547 | $312,453 |
| 2022 | $2,491 | $246,400 | $71,130 | $175,270 |
| 2021 | $2,187 | $321,000 | $90,356 | $230,644 |
| 2020 | $1,907 | $277,000 | $77,478 | $199,522 |
| 2019 | $1,825 | $259,000 | $89,243 | $169,757 |
| 2018 | $1,700 | $237,000 | $75,210 | $161,790 |
| 2016 | $1,494 | $107,525 | $29,433 | $78,092 |
| 2015 | $1,348 | $92,235 | $29,433 | $62,802 |
| 2014 | $1,419 | $98,638 | $29,433 | $69,205 |
| 2013 | -- | $86,765 | $25,230 | $61,535 |
Source: Public Records
Map
Nearby Homes
- 984 N 1100 W
- 1038 W 800 N
- 1121 N 900 W
- 1242 W 1075 N
- 1132 N 780 W
- 853 W 700 N
- 620 N 1100 W
- 690 Barlow St
- 721 N 800 W
- 652 W 800 N Unit 131
- 652 W 800 N Unit 62
- 1122 N 1500 W
- 1337 W 550 N Unit 195
- 922 W 1420 N
- 563 N 1350 W Unit 139
- 417 N 1200 W Unit 84
- 1350 W 300 N Unit 49
- 1350 W 300 N Unit 38
- 1350 W 300 N Unit 29
- 561 N 700 W