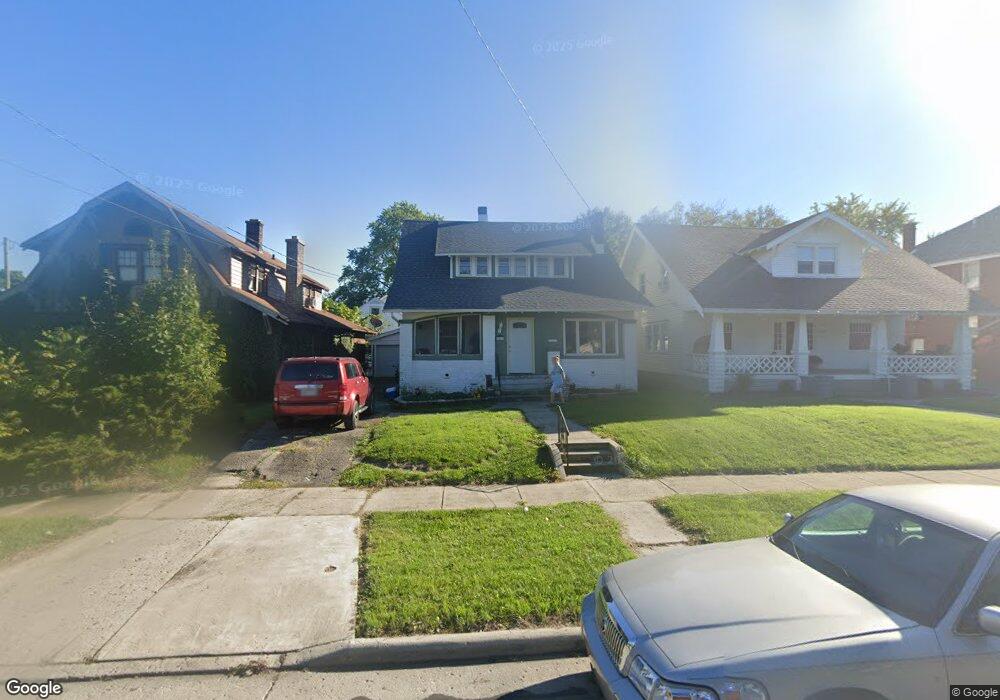
1051 W Elm St Lima, OH 45805
Riverside North NeighborhoodEstimated Value: $83,000 - $114,000
3
Beds
2
Baths
1,431
Sq Ft
$69/Sq Ft
Est. Value
About This Home
This home is located at 1051 W Elm St, Lima, OH 45805 and is currently estimated at $98,285, approximately $68 per square foot. 1051 W Elm St is a home located in Allen County with nearby schools including Heritage Elementary School, Lima West Middle School, and Lima North Middle School.
Ownership History
Date
Name
Owned For
Owner Type
Purchase Details
Closed on
Apr 4, 2022
Sold by
Renne Dennison Angela and Renne Alan Kid
Bought by
Kehres Benjamin Michael
Current Estimated Value
Purchase Details
Closed on
Jul 30, 2020
Sold by
Wicker Angela R and Dennison Kiel A
Bought by
Mitchell Amber
Home Financials for this Owner
Home Financials are based on the most recent Mortgage that was taken out on this home.
Original Mortgage
$48,100
Interest Rate
5.5%
Mortgage Type
Land Contract Argmt. Of Sale
Purchase Details
Closed on
Apr 14, 2005
Sold by
Connor Robert J O and Connor Jacqueline D O
Bought by
Wicker Angela R
Home Financials for this Owner
Home Financials are based on the most recent Mortgage that was taken out on this home.
Original Mortgage
$49,400
Interest Rate
5.88%
Mortgage Type
Future Advance Clause Open End Mortgage
Purchase Details
Closed on
Aug 14, 1987
Bought by
Oconnor Robert J
Create a Home Valuation Report for This Property
The Home Valuation Report is an in-depth analysis detailing your home's value as well as a comparison with similar homes in the area
Home Values in the Area
Average Home Value in this Area
Purchase History
| Date | Buyer | Sale Price | Title Company |
|---|---|---|---|
| Kehres Benjamin Michael | -- | Dennison Angela Renee | |
| Mitchell Amber | $49,900 | None Available | |
| Wicker Angela R | $52,000 | None Available | |
| Oconnor Robert J | $29,500 | -- |
Source: Public Records
Mortgage History
| Date | Status | Borrower | Loan Amount |
|---|---|---|---|
| Previous Owner | Mitchell Amber | $48,100 | |
| Previous Owner | Wicker Angela R | $49,400 |
Source: Public Records
Tax History
| Year | Tax Paid | Tax Assessment Tax Assessment Total Assessment is a certain percentage of the fair market value that is determined by local assessors to be the total taxable value of land and additions on the property. | Land | Improvement |
|---|---|---|---|---|
| 2024 | $1,132 | $30,460 | $2,560 | $27,900 |
| 2023 | $1,057 | $24,750 | $2,070 | $22,680 |
| 2022 | $1,087 | $24,750 | $2,070 | $22,680 |
| 2021 | $1,753 | $24,750 | $2,070 | $22,680 |
| 2020 | $1,027 | $20,410 | $1,960 | $18,450 |
| 2019 | $1,027 | $20,410 | $1,960 | $18,450 |
| 2018 | $1,162 | $20,410 | $1,960 | $18,450 |
| 2017 | $1,308 | $18,730 | $1,960 | $16,770 |
| 2016 | $964 | $18,730 | $1,960 | $16,770 |
| 2015 | $948 | $18,730 | $1,960 | $16,770 |
| 2014 | $948 | $18,100 | $2,030 | $16,070 |
| 2013 | $922 | $18,100 | $2,030 | $16,070 |
Source: Public Records
Map
Nearby Homes
- 233 S Kenilworth Ave
- 1211 W Elm St
- 1323 W Elm St
- 1160 W High St
- 411 S Collett St
- 932 Faurot Ave
- 705 W Elm St
- 308 S Judkins Ave
- 426 S Baxter St
- 210 S Baxter St
- 852 Faurot Ave
- 846 Faurot Ave
- 1440 W Market St
- 1023 Brice Ave
- 1027 Brice Ave
- 1508 Oakland Pkwy
- 784 S Judkins Ave
- 325 Nye St
- 503 N Charles St
- 513 N Charles St
Your Personal Tour Guide
Ask me questions while you tour the home.