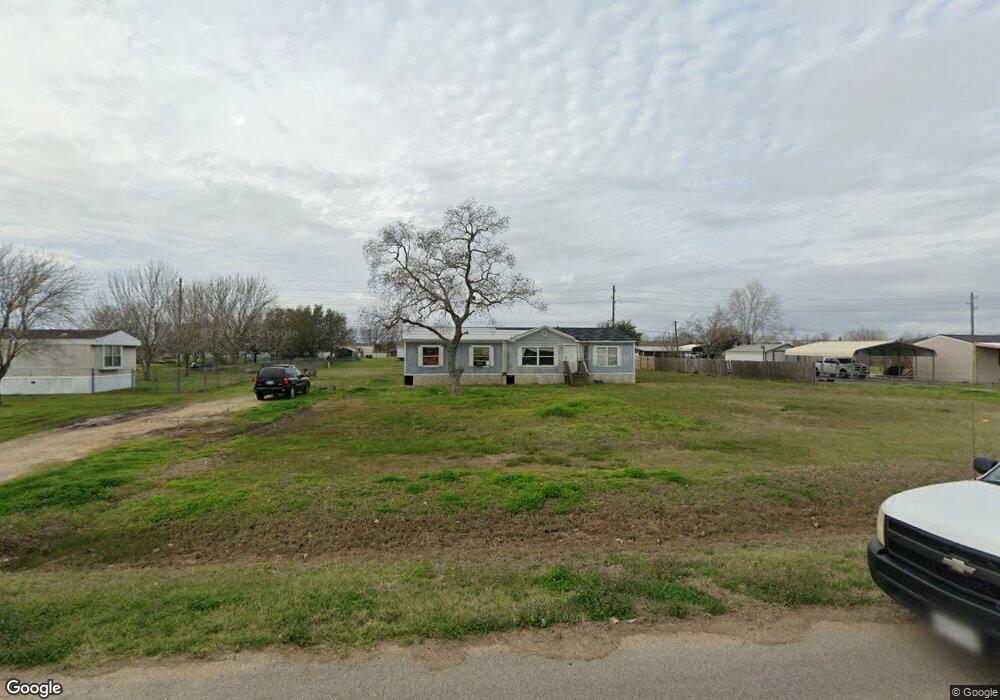
10510 Trey Rd Needville, TX 77461
Estimated Value: $275,000 - $328,000
4
Beds
2
Baths
1,750
Sq Ft
$173/Sq Ft
Est. Value
About This Home
This home is located at 10510 Trey Rd, Needville, TX 77461 and is currently estimated at $303,181, approximately $173 per square foot. 10510 Trey Rd is a home located in Fort Bend County with nearby schools including Needville Elementary School, Needville Middle School, and Needville Junior High School.
Ownership History
Date
Name
Owned For
Owner Type
Purchase Details
Closed on
Aug 16, 2012
Sold by
Craig Kenneth
Bought by
Charles Jessica A
Current Estimated Value
Purchase Details
Closed on
Jan 18, 2012
Sold by
Secretary Of Housing & Urban Development
Bought by
Craig Kenneth
Purchase Details
Closed on
Aug 12, 2011
Sold by
Midfirst Bank
Bought by
The Secretary Of Housing & Urban Develop
Purchase Details
Closed on
Aug 2, 2011
Sold by
Sanchez Rafeal G and Sanchez Dolores P
Bought by
Midfirst Bank
Purchase Details
Closed on
Oct 19, 2007
Sold by
Arg Rose Meadows Ltd
Bought by
Sanchez Rafeal G and Sanchez Dolores P
Home Financials for this Owner
Home Financials are based on the most recent Mortgage that was taken out on this home.
Original Mortgage
$130,649
Interest Rate
6.37%
Mortgage Type
FHA
Create a Home Valuation Report for This Property
The Home Valuation Report is an in-depth analysis detailing your home's value as well as a comparison with similar homes in the area
Home Values in the Area
Average Home Value in this Area
Purchase History
| Date | Buyer | Sale Price | Title Company |
|---|---|---|---|
| Charles Jessica A | -- | None Available | |
| Charles Jessica A | -- | -- | |
| Craig Kenneth | -- | First American Title | |
| Charles Jessica A | -- | -- | |
| The Secretary Of Housing & Urban Develop | -- | None Available | |
| Charles Jessica A | -- | -- | |
| Midfirst Bank | $135,593 | None Available | |
| Sanchez Rafeal G | -- | United Title Of Texas |
Source: Public Records
Mortgage History
| Date | Status | Borrower | Loan Amount |
|---|---|---|---|
| Previous Owner | Sanchez Rafeal G | $130,649 |
Source: Public Records
Tax History Compared to Growth
Tax History
| Year | Tax Paid | Tax Assessment Tax Assessment Total Assessment is a certain percentage of the fair market value that is determined by local assessors to be the total taxable value of land and additions on the property. | Land | Improvement |
|---|---|---|---|---|
| 2025 | $1,276 | $152,227 | $39,390 | $139,540 |
| 2024 | $1,276 | $138,388 | -- | $139,540 |
| 2023 | $1,053 | $125,807 | $0 | $126,250 |
| 2022 | $1,637 | $114,370 | $0 | $146,190 |
| 2021 | $1,971 | $103,970 | $30,300 | $73,670 |
| 2020 | $1,911 | $94,520 | $30,300 | $64,220 |
| 2019 | $1,845 | $85,930 | $30,300 | $55,630 |
| 2018 | $1,675 | $78,120 | $30,300 | $47,820 |
| 2017 | $1,528 | $71,020 | $27,500 | $43,520 |
| 2016 | $1,389 | $64,560 | $27,500 | $37,060 |
| 2015 | $835 | $58,690 | $27,500 | $31,190 |
| 2014 | $892 | $53,350 | $27,500 | $25,850 |
Source: Public Records
Map
Nearby Homes
- 11203 Leah Elizabeth Dr
- 11310 Audrey Dr
- 11102 Aaron Way
- 10335 Filly Dr
- 10202 Harry Dr
- 0 Jeske Rd Unit 44835741
- 10507 Padon Rd
- 11814 Roesler Rd
- 11127 Moon Light Dr
- 11019 Water Tower Dr
- 10853 Padon Rd
- 11034 Moon Light Dr
- 11018 Moon Light Dr
- Model #2781 Plan at Blue Jay's Landing
- Model #2555 Plan at Blue Jay's Landing
- Model #2295 Plan at Blue Jay's Landing
- Model #2497 Plan at Blue Jay's Landing
- Model #2306 Plan at Blue Jay's Landing
- Model #2381 Plan at Blue Jay's Landing
- Model #3086 Plan at Blue Jay's Landing
- 10506 Trey Rd
- 10511 Harry Dr
- 11214 Leah Elizabeth Dr
- 10606 Trey Rd
- 11215 Leah Elizabeth Dr
- 11215 Emily Ruth Dr
- 10503 Harry Dr
- 11211 Leah Elizabeth Dr
- 10414 Trey Dr
- 10414 Trey Rd
- 11211 Emily Ruth Dr
- 10510 Harry Dr
- 10506 Harry Dr
- 11314 April Dr
- 11210 Leah Elizabeth Dr
- 11214 April Dr
- 10602 Harry Dr
- 11207 Leah Elizabeth Dr
- 10502 Harry Dr
- 10411 Trey Rd