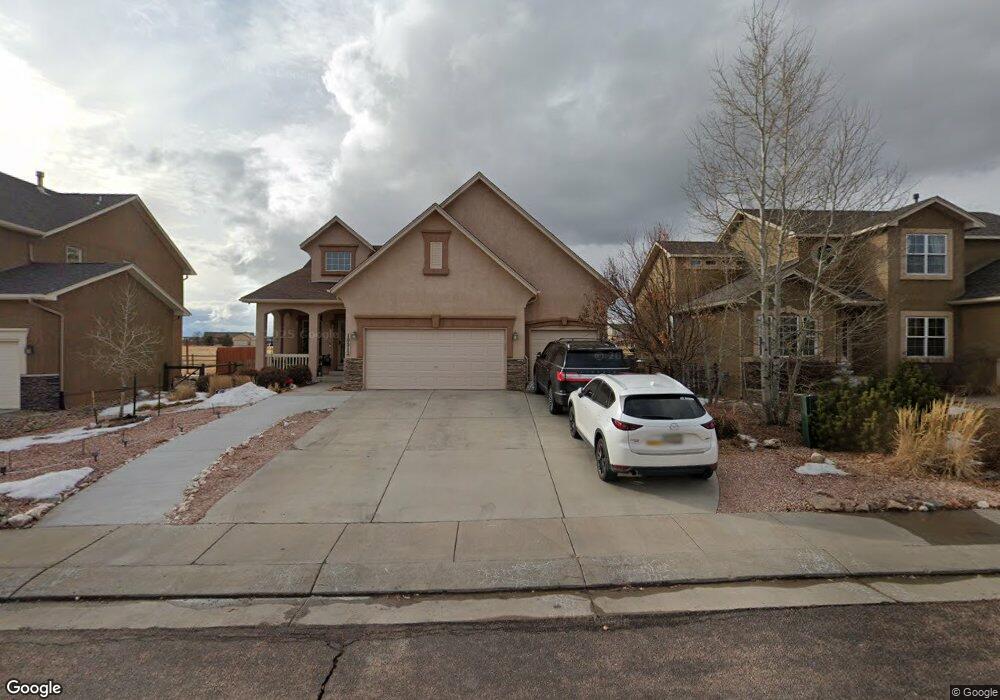
10512 Cedar Breaks Dr Peyton, CO 80831
Falcon NeighborhoodEstimated Value: $550,000 - $571,000
4
Beds
3
Baths
3,778
Sq Ft
$148/Sq Ft
Est. Value
About This Home
This home is located at 10512 Cedar Breaks Dr, Peyton, CO 80831 and is currently estimated at $560,265, approximately $148 per square foot. 10512 Cedar Breaks Dr is a home located in El Paso County with nearby schools including Meridian Ranch Elementary School, Falcon Middle School, and Falcon High School.
Ownership History
Date
Name
Owned For
Owner Type
Purchase Details
Closed on
Dec 1, 2016
Sold by
Vogt James F and Vogt Ruth L
Bought by
Sokol Beverly M Ovalle and Sokol Eric A
Current Estimated Value
Home Financials for this Owner
Home Financials are based on the most recent Mortgage that was taken out on this home.
Original Mortgage
$275,793
Outstanding Balance
$222,560
Interest Rate
3.5%
Mortgage Type
FHA
Estimated Equity
$337,705
Purchase Details
Closed on
Sep 16, 2005
Sold by
Creekstone Development Inc
Bought by
Vogt James F and Vogt Ruth L
Home Financials for this Owner
Home Financials are based on the most recent Mortgage that was taken out on this home.
Original Mortgage
$265,600
Interest Rate
5.75%
Mortgage Type
Fannie Mae Freddie Mac
Purchase Details
Closed on
Apr 7, 2004
Sold by
Gtl Inc
Bought by
Creekstone Development Inc and Creekstone Homes Inc
Create a Home Valuation Report for This Property
The Home Valuation Report is an in-depth analysis detailing your home's value as well as a comparison with similar homes in the area
Home Values in the Area
Average Home Value in this Area
Purchase History
| Date | Buyer | Sale Price | Title Company |
|---|---|---|---|
| Sokol Beverly M Ovalle | $307,800 | Heritage Title Co | |
| Vogt James F | $332,000 | Security Title | |
| Creekstone Development Inc | $67,700 | Fahtco |
Source: Public Records
Mortgage History
| Date | Status | Borrower | Loan Amount |
|---|---|---|---|
| Open | Sokol Beverly M Ovalle | $275,793 | |
| Previous Owner | Vogt James F | $265,600 |
Source: Public Records
Tax History
| Year | Tax Paid | Tax Assessment Tax Assessment Total Assessment is a certain percentage of the fair market value that is determined by local assessors to be the total taxable value of land and additions on the property. | Land | Improvement |
|---|---|---|---|---|
| 2025 | $3,685 | $39,040 | -- | -- |
| 2024 | $3,556 | $39,680 | $9,000 | $30,680 |
| 2022 | $2,879 | $28,530 | $7,390 | $21,140 |
| 2021 | $2,984 | $29,350 | $7,600 | $21,750 |
| 2020 | $2,855 | $26,030 | $6,890 | $19,140 |
| 2019 | $2,839 | $26,030 | $6,890 | $19,140 |
| 2018 | $2,592 | $23,530 | $6,300 | $17,230 |
| 2017 | $2,452 | $23,530 | $6,300 | $17,230 |
| 2016 | $2,358 | $23,170 | $6,970 | $16,200 |
| 2015 | $2,359 | $23,170 | $6,970 | $16,200 |
| 2014 | $2,232 | $21,650 | $5,970 | $15,680 |
Source: Public Records
Map
Nearby Homes
- 10488 Cedar Breaks Dr
- 10489 Cedar Breaks Dr
- 10429 Cedar Breaks Dr
- 10467 Pictured Rocks Dr
- 12320 Grand Teton Dr
- 10476 Ross Lake Dr
- 10342 Biscayne Dr
- 10603 Ross Lake Dr
- 12534 Angelina Dr
- 10803 Greenbelt Dr
- 12144 Point Reyes Dr
- 12252 Point Reyes Dr
- 12705 Angelina Dr
- 12272 Isle Royale Dr
- 11674 Allendale Dr
- 10135 Kings Canyon Dr
- 12431 Mount Bross Place
- 10952 Torreys Peak Way
- 12216 Chimney Smoke Dr
- 12256 Chimney Smoke Dr
- 10524 Cedar Breaks Dr
- 10536 Cedar Breaks Dr
- 10476 Cedar Breaks Dr
- 10548 Cedar Breaks Dr
- 10525 Cedar Breaks Dr
- 10464 Cedar Breaks Dr
- 10477 Cedar Breaks Dr
- 10537 Cedar Breaks Dr
- 10560 Cedar Breaks Dr
- 10465 Cedar Breaks Dr
- 10452 Cedar Breaks Dr
- 10549 Cedar Breaks Dr
- 10453 Cedar Breaks Dr
- 10561 Cedar Breaks Dr
- 10440 Cedar Breaks Dr
- 10441 Cedar Breaks Dr
- 10573 Cedar Breaks Dr
- 10584 Cedar Breaks Dr
- 10428 Cedar Breaks Dr
- 12204 Angelina Dr
Your Personal Tour Guide
Ask me questions while you tour the home.