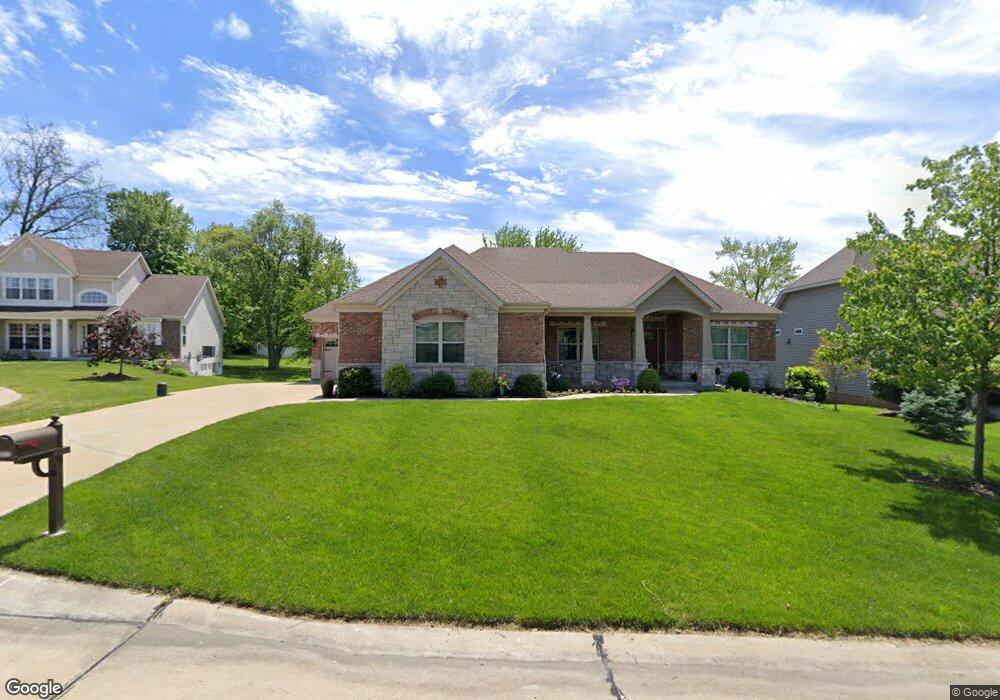
10512 Sapphire Ridge Ct Unit 3 Saint Louis, MO 63128
Sappington NeighborhoodEstimated Value: $614,000 - $745,000
3
Beds
3
Baths
2,558
Sq Ft
$269/Sq Ft
Est. Value
About This Home
This home is located at 10512 Sapphire Ridge Ct Unit 3, Saint Louis, MO 63128 and is currently estimated at $688,555, approximately $269 per square foot. 10512 Sapphire Ridge Ct Unit 3 is a home located in St. Louis County with nearby schools including Concord Elementary School, Sperreng Middle School, and Lindbergh High School.
Ownership History
Date
Name
Owned For
Owner Type
Purchase Details
Closed on
Jan 4, 2022
Sold by
Bruno James E and Bruno Carolyn G
Bought by
Revocable Living Trust
Current Estimated Value
Purchase Details
Closed on
Jul 29, 2019
Sold by
Melies Scott A and Melies Babettle L
Bought by
Bruno James E and Bruno Carolyn F
Purchase Details
Closed on
Oct 12, 2012
Sold by
Moll Properties Llc
Bought by
Melies Scott A and Melies Babette L
Purchase Details
Closed on
Mar 9, 2011
Sold by
Bank Of America N A
Bought by
Moll Properties Llc
Purchase Details
Closed on
Jul 25, 2008
Sold by
Benchmark Developers Llc
Bought by
Mayer Custom Homes Inc
Purchase Details
Closed on
Nov 2, 2007
Sold by
Declaration Of Trust Of Cecilia H Philli
Bought by
Benchmark Developers Llc
Create a Home Valuation Report for This Property
The Home Valuation Report is an in-depth analysis detailing your home's value as well as a comparison with similar homes in the area
Home Values in the Area
Average Home Value in this Area
Purchase History
| Date | Buyer | Sale Price | Title Company |
|---|---|---|---|
| Revocable Living Trust | -- | None Listed On Document | |
| Bruno James E | -- | Title Partners Agency Llc | |
| Melies Scott A | $125,000 | Us Title Main | |
| Moll Properties Llc | $90,000 | Ust | |
| Mayer Custom Homes Inc | $320,000 | Sec | |
| Benchmark Developers Llc | $150,000 | Fa |
Source: Public Records
Mortgage History
| Date | Status | Borrower | Loan Amount |
|---|---|---|---|
| Closed | Benchmark Developers Llc | -- |
Source: Public Records
Tax History Compared to Growth
Tax History
| Year | Tax Paid | Tax Assessment Tax Assessment Total Assessment is a certain percentage of the fair market value that is determined by local assessors to be the total taxable value of land and additions on the property. | Land | Improvement |
|---|---|---|---|---|
| 2025 | $7,309 | $121,950 | $22,520 | $99,430 |
| 2024 | $7,309 | $112,720 | $20,630 | $92,090 |
| 2023 | $7,291 | $112,720 | $20,630 | $92,090 |
| 2022 | $6,208 | $92,060 | $22,520 | $69,540 |
| 2021 | $5,987 | $92,060 | $22,520 | $69,540 |
| 2020 | $6,180 | $91,700 | $19,250 | $72,450 |
| 2019 | $6,164 | $91,700 | $19,250 | $72,450 |
| 2018 | $5,362 | $72,520 | $10,640 | $61,880 |
| 2017 | $5,304 | $72,520 | $10,640 | $61,880 |
| 2016 | $5,757 | $74,770 | $11,590 | $63,180 |
| 2015 | $5,669 | $74,770 | $11,590 | $63,180 |
| 2014 | $5,488 | $71,670 | $24,340 | $47,330 |
Source: Public Records
Map
Nearby Homes
- 20 Oleander Dr
- 10508 Stephenson Dr
- 10727 Roxanna Dr
- 10627 Leebur Dr
- 10652 Roanna Ln
- 10000 Hilltop Dr
- 10573 Carroll Wood Way
- 10831 Carroll Wood Way
- 10525 Carroll Wood Way
- 10819 Carroll Wood Way
- 10622 Carroll Wood Way
- 10682 Carroll Wood Way Unit 3
- 10140 Sakura Dr
- 10124 Carolynne Dr
- 10315 Kennerly Rd
- 9411 Gates Manor Ct
- 9404 Gates Manor Ct
- 10117 Sakura Dr Unit F
- 9448 Parklind Dr
- 9918 Benbury Ct Unit 1D
- 10512 Sapphire Ridge Ct
- 10516 Sapphire Ridge Ct
- 10506 Sapphire Ridge Ct
- 10581 Sunset Pines Ct
- 10573 Sunset Pines Ct
- 10520 Sapphire Ridge Ct
- 10589 Sunset Pines Ct
- 9816 Sappington Rd
- 10502 Sapphire Ridge Ct
- 10561 Stephenson Dr
- 10572 Sunset Pines Ct
- 10597 Sunset Pines Ct
- 9812 Sappington Rd
- 10553 Stephenson Dr
- 10601 Rebecca Dr
- 10586 Sunset Pines Ct
- 9827 Sappington Rd
- 10545 Trail Ridge Dr
- 10594 Sunset Pines Ct
- 9819 Sappington Rd