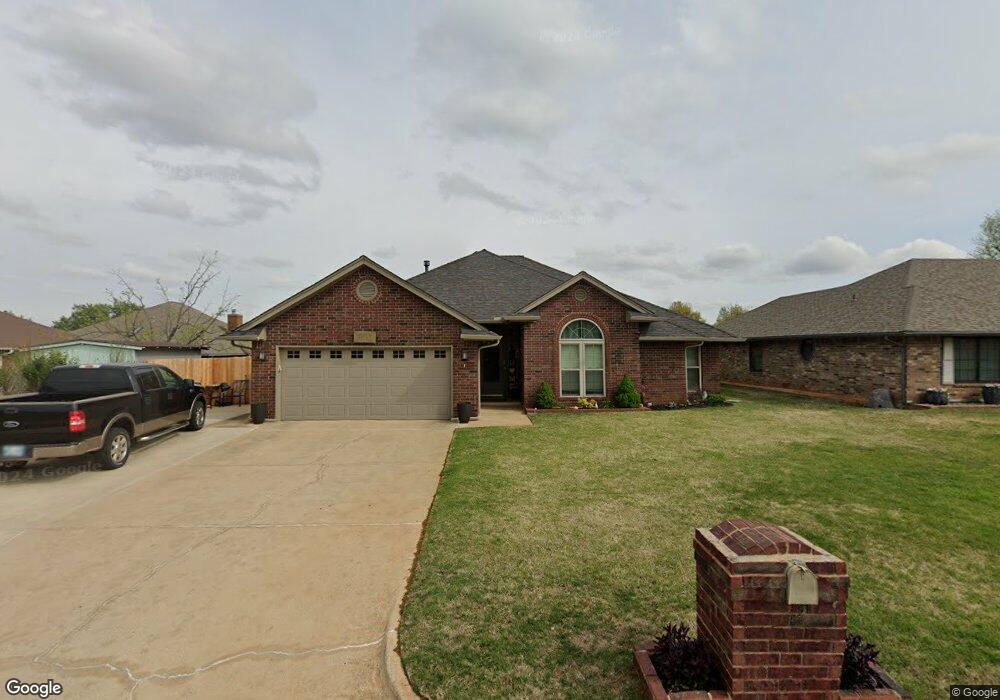
10513 Quail Run Rd Oklahoma City, OK 73130
Estimated Value: $253,000 - $272,000
3
Beds
2
Baths
1,806
Sq Ft
$144/Sq Ft
Est. Value
About This Home
This home is located at 10513 Quail Run Rd, Oklahoma City, OK 73130 and is currently estimated at $260,158, approximately $144 per square foot. 10513 Quail Run Rd is a home located in Oklahoma County with nearby schools including Nicoma Park Elementary School, Nicoma Park Intermediate Elementary School, and Nicoma Park Middle School.
Ownership History
Date
Name
Owned For
Owner Type
Purchase Details
Closed on
Apr 25, 2012
Sold by
Pollard Justin E and Pollard Stephanie A
Bought by
Cruze Brandon J and Cruze Sheila A
Current Estimated Value
Home Financials for this Owner
Home Financials are based on the most recent Mortgage that was taken out on this home.
Original Mortgage
$135,850
Outstanding Balance
$94,652
Interest Rate
4.02%
Mortgage Type
New Conventional
Estimated Equity
$165,506
Purchase Details
Closed on
Nov 10, 2003
Sold by
Brantley Stanley K
Bought by
Pollard Justin E and Pollard Stephanie A
Home Financials for this Owner
Home Financials are based on the most recent Mortgage that was taken out on this home.
Original Mortgage
$103,920
Interest Rate
5.81%
Mortgage Type
Purchase Money Mortgage
Purchase Details
Closed on
Sep 21, 1998
Sold by
Anderson Hobie E and Anderson Kelly C
Bought by
Brantley Stanley K
Create a Home Valuation Report for This Property
The Home Valuation Report is an in-depth analysis detailing your home's value as well as a comparison with similar homes in the area
Home Values in the Area
Average Home Value in this Area
Purchase History
| Date | Buyer | Sale Price | Title Company |
|---|---|---|---|
| Cruze Brandon J | $143,000 | Fatco | |
| Pollard Justin E | $130,000 | First American Title & Tr Co | |
| Brantley Stanley K | $103,500 | Stewart Escrow & Title |
Source: Public Records
Mortgage History
| Date | Status | Borrower | Loan Amount |
|---|---|---|---|
| Open | Cruze Brandon J | $135,850 | |
| Previous Owner | Pollard Justin E | $103,920 |
Source: Public Records
Tax History Compared to Growth
Tax History
| Year | Tax Paid | Tax Assessment Tax Assessment Total Assessment is a certain percentage of the fair market value that is determined by local assessors to be the total taxable value of land and additions on the property. | Land | Improvement |
|---|---|---|---|---|
| 2024 | $2,412 | $20,365 | $3,605 | $16,760 |
| 2023 | $2,412 | $19,771 | $2,684 | $17,087 |
| 2022 | $2,315 | $19,196 | $3,062 | $16,134 |
| 2021 | $2,234 | $18,637 | $3,384 | $15,253 |
| 2020 | $2,183 | $18,095 | $3,465 | $14,630 |
| 2019 | $2,148 | $18,014 | $3,053 | $14,961 |
| 2018 | $1,973 | $17,490 | $0 | $0 |
| 2017 | $1,913 | $16,999 | $3,009 | $13,990 |
| 2016 | $1,870 | $16,504 | $3,027 | $13,477 |
| 2015 | $1,877 | $16,024 | $2,878 | $13,146 |
| 2014 | $1,827 | $15,558 | $2,926 | $12,632 |
Source: Public Records
Map
Nearby Homes
- 1917 Goldenrod Ln
- 10553 SE 23rd St
- 10323 Haven Cir
- 2320 Celina Dr
- 2328 Celina Dr
- 2332 Snapper Ln
- 2402 Cattail Cir
- 2319 Shell Dr
- 2301 S Westminster Rd
- 1501 S Avery Ave
- 10216 Alicia Dr
- 10820 Ohara Ln
- 2504 Marsh Ln
- 2512 Marsh Ln
- 2516 Marsh Ln
- 2508 Marsh Ln
- 2405 Shell Dr
- 2611 Turtle Way
- 2558 Turtle Way
- 2557 Turtle Way
- 10517 Quail Run Rd
- 1920 Goldenrod Ln
- 1916 Goldenrod Ln
- 1909 Honeysuckle Ln
- 10521 Quail Run Rd
- 1908 Goldenrod Ln
- 10512 Quail Run Rd
- 10516 Quail Run Rd
- 1913 Honeysuckle Ln
- 10520 Quail Run Rd
- 10508 Quail Run Rd
- 10525 Quail Run Rd
- 1904 Goldenrod Ln
- 1905 Honeysuckle Ln
- 10524 Quail Run Rd
- 1900 Goldenrod Ln
- 2001 Goldenrod Ln
- 1913 Goldenrod Ln
- 1912 Honeysuckle Ln
- 2012 Goldenrod Ln