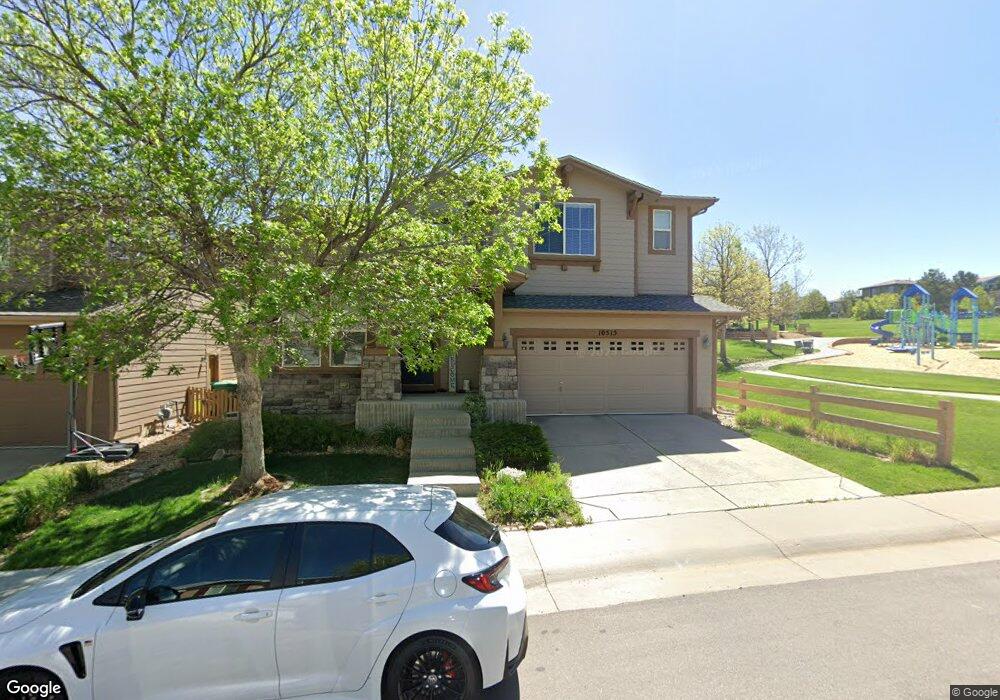
10515 Applebrook Cir Highlands Ranch, CO 80130
Southridge NeighborhoodEstimated Value: $750,147 - $814,000
4
Beds
4
Baths
2,624
Sq Ft
$300/Sq Ft
Est. Value
About This Home
This home is located at 10515 Applebrook Cir, Highlands Ranch, CO 80130 and is currently estimated at $786,537, approximately $299 per square foot. 10515 Applebrook Cir is a home located in Douglas County with nearby schools including Redstone Elementary School, Rocky Heights Middle School, and Rock Canyon High School.
Ownership History
Date
Name
Owned For
Owner Type
Purchase Details
Closed on
Mar 17, 2022
Sold by
Opendoor Property Trust
Bought by
Mark And Pamela Old 2015 Living Trust
Current Estimated Value
Home Financials for this Owner
Home Financials are based on the most recent Mortgage that was taken out on this home.
Original Mortgage
$653,600
Outstanding Balance
$612,301
Interest Rate
4.16%
Mortgage Type
New Conventional
Estimated Equity
$174,236
Purchase Details
Closed on
Dec 16, 2021
Sold by
Nowak Edward J and Nowak Sara W
Bought by
Opendoor Property Trust
Purchase Details
Closed on
May 10, 2005
Sold by
Shea Homes Lp
Bought by
Nowak Edward J and Nowak Sara W
Home Financials for this Owner
Home Financials are based on the most recent Mortgage that was taken out on this home.
Original Mortgage
$264,500
Interest Rate
5.79%
Mortgage Type
Fannie Mae Freddie Mac
Create a Home Valuation Report for This Property
The Home Valuation Report is an in-depth analysis detailing your home's value as well as a comparison with similar homes in the area
Home Values in the Area
Average Home Value in this Area
Purchase History
| Date | Buyer | Sale Price | Title Company |
|---|---|---|---|
| Mark And Pamela Old 2015 Living Trust | $817,000 | None Listed On Document | |
| Opendoor Property Trust | $695,000 | None Listed On Document | |
| Nowak Edward J | $330,660 | North American Title |
Source: Public Records
Mortgage History
| Date | Status | Borrower | Loan Amount |
|---|---|---|---|
| Open | Mark And Pamela Old 2015 Living Trust | $653,600 | |
| Previous Owner | Nowak Edward J | $264,500 |
Source: Public Records
Tax History Compared to Growth
Tax History
| Year | Tax Paid | Tax Assessment Tax Assessment Total Assessment is a certain percentage of the fair market value that is determined by local assessors to be the total taxable value of land and additions on the property. | Land | Improvement |
|---|---|---|---|---|
| 2024 | $4,722 | $53,780 | $9,790 | $43,990 |
| 2023 | $4,713 | $53,780 | $9,790 | $43,990 |
| 2022 | $3,534 | $38,680 | $6,730 | $31,950 |
| 2021 | $3,675 | $38,680 | $6,730 | $31,950 |
| 2020 | $3,446 | $37,160 | $6,990 | $30,170 |
| 2019 | $3,459 | $37,160 | $6,990 | $30,170 |
| 2018 | $3,225 | $34,120 | $6,160 | $27,960 |
| 2017 | $2,936 | $34,120 | $6,160 | $27,960 |
| 2016 | $2,945 | $33,590 | $5,340 | $28,250 |
| 2015 | $1,504 | $33,590 | $5,340 | $28,250 |
| 2014 | $2,662 | $27,440 | $5,310 | $22,130 |
Source: Public Records
Map
Nearby Homes
- 5639 Jaguar Way
- 10497 Wagon Box Cir
- 10445 Cheetah Winds
- 10645 Cedarcrest Cir
- 10439 Cheetah Winds
- 10660 Jewelberry Cir
- 10557 Jaguar Dr
- 5632 Tory Pointe
- 10754 Towerbridge Cir
- 6042 Sima Cir
- 10278 Dan Ct
- 10557 Eby Cir
- 10541 Jaguar Glen
- 10292 Nickolas Ave
- 10360 Tracewood Ct
- 4967 Waldenwood Dr
- 4931 Waldenwood Dr
- 10296 Lauren Ct
- 10375 Lions Heart
- 4656 Ketchwood Cir
- 10511 Applebrook Cir
- 10507 Applebrook Cir
- 10588 Wagon Box Cir
- 10586 Wagon Box Cir
- 10584 Wagon Box Cir
- 10516 Applebrook Cir
- 10512 Applebrook Cir
- 10503 Applebrook Cir
- 10508 Applebrook Cir
- 10580 Wagon Box Cir
- 10524 Applebrook Cir
- 10501 Applebrook Cir
- 10528 Applebrook Cir
- 10576 Wagon Box Cir
- 10472 Applebrook Cir
- 10474 Applebrook Cir
- 10468 Applebrook Cir
- 10499 Applebrook Cir
- 10480 Applebrook Cir
- 5549 Fox Meadow Ave