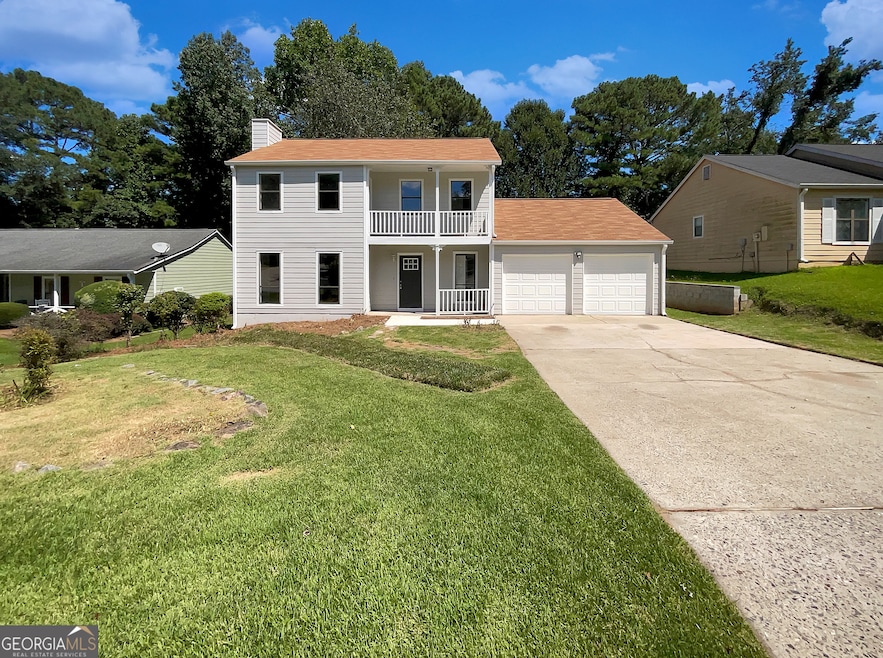
10515 Colony Glen Dr Unit 2 Alpharetta, GA 30022
Estimated payment $2,803/month
Highlights
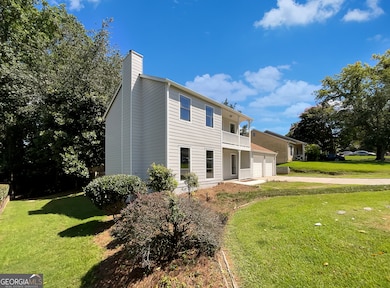
- Deck
- Private Lot
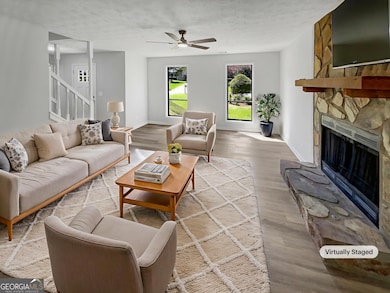
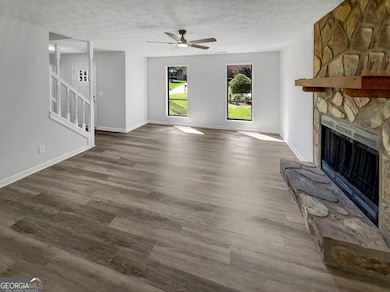
- Wood Flooring
- Dolvin Elementary School Rated A
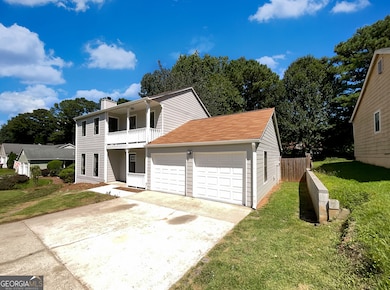
- Traditional Architecture
- Solid Surface Countertops
About This Home
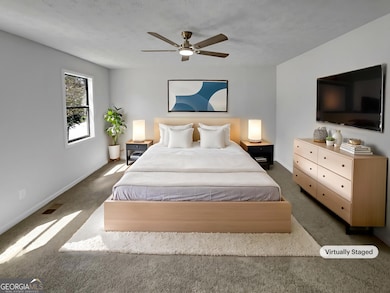
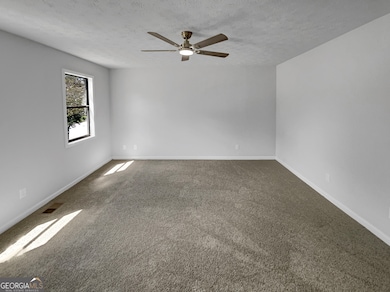
Welcome to this beautifully updated home in the heart of Alpharetta! Just off the entrance, you'll find a convenient half bath. The bright white kitchen opens with a sliding door to a brand-new deck, perfect for outdoor dining and entertaining. Adjacent to the kitchen are the laundry room, double garage, and an extra storage area for added convenience. A separate dining room and a spacious living room with a cozy stone fireplace complete the main level. Upstairs, the home offers three bedrooms and two full baths, including a lovely owner's suite with a private walk-out front porch. Enjoy a peaceful backyard retreat ideal for relaxing or gathering with friends. With thoughtful updates throughout, this home blends modern comfort with charm-all in a sought-after Alpharetta location.
Home Details
Home Type
- Single Family
Est. Annual Taxes
- $4,662
Year Built
- Built in 1985
Lot Details
- 10,454 Sq Ft Lot
- Back Yard Fenced
- Private Lot
Parking
- 2 Car Garage
Home Design
- Traditional Architecture
- Composition Roof
Interior Spaces
- 2-Story Property
- Double Pane Windows
- Family Room with Fireplace
Kitchen
- Breakfast Area or Nook
- Microwave
- Dishwasher
- Solid Surface Countertops
Flooring
- Wood
- Carpet
Bedrooms and Bathrooms
- 3 Bedrooms
Laundry
- Laundry Room
- Laundry in Kitchen
Schools
- Dolvin Elementary School
- Autrey Milll Middle School
- Johns Creek High School
Utilities
- Forced Air Heating and Cooling System
- Heating System Uses Natural Gas
- Phone Available
- Cable TV Available
Additional Features
- Energy-Efficient Thermostat
- Deck
Community Details
- No Home Owners Association
- Colony Glen Subdivision
Map
Home Values in the Area
Average Home Value in this Area
Tax History
| Year | Tax Paid | Tax Assessment Tax Assessment Total Assessment is a certain percentage of the fair market value that is determined by local assessors to be the total taxable value of land and additions on the property. | Land | Improvement |
|---|---|---|---|---|
| 2025 | $4,662 | $172,360 | $31,920 | $140,440 |
| 2023 | $4,087 | $144,800 | $32,800 | $112,000 |
| 2022 | $3,756 | $122,400 | $26,080 | $96,320 |
| 2021 | $3,070 | $97,440 | $18,440 | $79,000 |
| 2020 | $2,645 | $82,160 | $18,000 | $64,160 |
| 2019 | $318 | $80,760 | $17,720 | $63,040 |
| 2018 | $2,265 | $69,560 | $16,600 | $52,960 |
| 2017 | $1,621 | $47,640 | $14,320 | $33,320 |
| 2016 | $1,598 | $47,640 | $14,320 | $33,320 |
| 2015 | $1,616 | $47,640 | $14,320 | $33,320 |
| 2014 | $1,423 | $40,360 | $9,160 | $31,200 |
Property History
| Date | Event | Price | List to Sale | Price per Sq Ft |
|---|---|---|---|---|
| 10/23/2025 10/23/25 | Price Changed | $458,000 | -0.7% | -- |
| 10/09/2025 10/09/25 | Price Changed | $461,000 | -0.9% | -- |
| 09/06/2025 09/06/25 | For Sale | $465,000 | -- | -- |
Purchase History
| Date | Type | Sale Price | Title Company |
|---|---|---|---|
| Warranty Deed | $365,500 | -- | |
| Quit Claim Deed | -- | -- | |
| Deed | $106,000 | -- | |
| Deed | $89,500 | -- |
Mortgage History
| Date | Status | Loan Amount | Loan Type |
|---|---|---|---|
| Previous Owner | $102,000 | New Conventional | |
| Previous Owner | $95,400 | New Conventional | |
| Closed | -- | Seller Take Back |
Source: Georgia MLS
MLS Number: 10599458
APN: 11-0183-0076-041-9
Disclaimer: Certain information contained herein is derived from information provided by parties other than Homes.com. All information provided is deemed reliable, but is not guaranteed to be accurate and should be independently verified.
![]() The data relating to real estate for sale on this web site comes in part from the Broker Reciprocity Program of Georgia MLS. Real estate listings held by brokerage firms other than Redfin are marked with the Broker Reciprocity logo and detailed information about them includes the name of the listing brokers. Information deemed reliable but not guaranteed. Copyright 2025 Georgia MLS. All rights reserved.
The data relating to real estate for sale on this web site comes in part from the Broker Reciprocity Program of Georgia MLS. Real estate listings held by brokerage firms other than Redfin are marked with the Broker Reciprocity logo and detailed information about them includes the name of the listing brokers. Information deemed reliable but not guaranteed. Copyright 2025 Georgia MLS. All rights reserved.
- 115 Willow View Point
- 10405 Meadow Crest Ln
- 10415 Plantation Bridge Dr
- 710 Country Manor Way
- 125 Oak Bridge Ct Unit 2
- 10325 Oxford Mill Cir Unit 1
- 10530 Tuxford Dr
- 120 Thome Dr
- 285 Rolling Mist Ct
- 415 Wood Trace Ct
- 510 Winborne Place Unit VI
- 235 Wood Shoals Ct
- 10880 Windham Way
- 115 Thome Dr
- 10050 Lauren Hall Ct
- 125 Sandridge Ct
- 105 Kimball Bridge Cove
- 465 Kirkstall Trail
- 105 Brooks Bridge Ct
- 10635 Plantation Bridge Dr
- 4060 Brooks Bridge Crossing
- 305 Pilgrimage Point
- 10780 Carrara Cove
- 10055 Jones Bridge Rd Unit 2308
- 10055 Jones Bridge Rd Unit 509
- 10805 Pinewalk Forest Cir
- 115 Thome Dr
- 10012 Parc Sky Cir
- 345 Outwood Mill Ct
- 10630 Timberstone Rd
- 9830 Autry Falls Dr
- 11080 Kimball Crest Dr
- 4645 Valais Ct Unit 124
- 4645 Valais Ct Unit 90
- 4645 Valais Ct Unit 53
- 4645 Valais Ct Unit 114
- 4645 Valais Ct Unit 32
- 10840 State Bridge Rd
