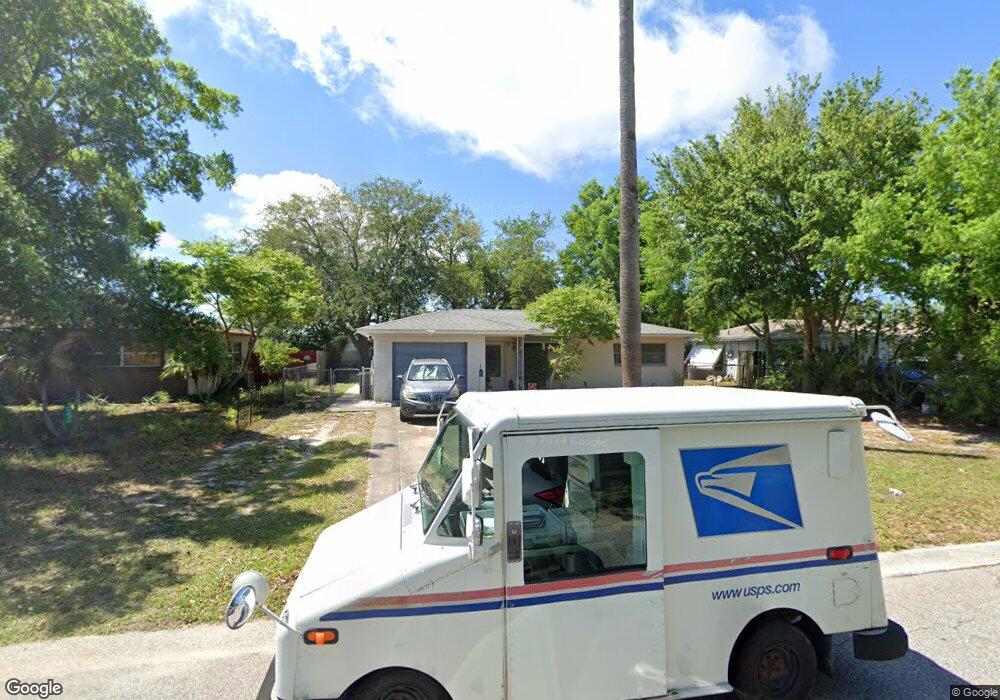
10517 Raffia Dr Port Richey, FL 34668
Estimated Value: $159,000 - $193,000
2
Beds
2
Baths
1,098
Sq Ft
$163/Sq Ft
Est. Value
About This Home
This home is located at 10517 Raffia Dr, Port Richey, FL 34668 and is currently estimated at $178,944, approximately $162 per square foot. 10517 Raffia Dr is a home located in Pasco County with nearby schools including Schrader Elementary School, Bayonet Point Middle School, and Fivay High School.
Ownership History
Date
Name
Owned For
Owner Type
Purchase Details
Closed on
Feb 18, 2025
Sold by
Hahne Margie L and Hahne Eugene A
Bought by
Rouse Thomas and Rouse Misti
Current Estimated Value
Home Financials for this Owner
Home Financials are based on the most recent Mortgage that was taken out on this home.
Original Mortgage
$68,250
Outstanding Balance
$64,708
Interest Rate
7.04%
Mortgage Type
Seller Take Back
Estimated Equity
$114,236
Purchase Details
Closed on
Aug 10, 2012
Sold by
Macchi Richard and Macchi Linda
Bought by
Hahne Eugene A and Hahne Margie L
Purchase Details
Closed on
Aug 25, 2009
Sold by
Hahne Eugene A and Hahne Margie L
Bought by
Macchi Richard and Macchi Linda
Home Financials for this Owner
Home Financials are based on the most recent Mortgage that was taken out on this home.
Original Mortgage
$70,500
Interest Rate
7%
Mortgage Type
Seller Take Back
Create a Home Valuation Report for This Property
The Home Valuation Report is an in-depth analysis detailing your home's value as well as a comparison with similar homes in the area
Home Values in the Area
Average Home Value in this Area
Purchase History
| Date | Buyer | Sale Price | Title Company |
|---|---|---|---|
| Rouse Thomas | $180,000 | Frontier Title Group | |
| Rouse Thomas | $180,000 | Frontier Title Group | |
| Hahne Eugene A | $70,000 | Attorney | |
| Macchi Richard | $70,500 | Attorney |
Source: Public Records
Mortgage History
| Date | Status | Borrower | Loan Amount |
|---|---|---|---|
| Open | Rouse Thomas | $68,250 | |
| Closed | Rouse Thomas | $68,250 | |
| Previous Owner | Macchi Richard | $70,500 |
Source: Public Records
Tax History Compared to Growth
Tax History
| Year | Tax Paid | Tax Assessment Tax Assessment Total Assessment is a certain percentage of the fair market value that is determined by local assessors to be the total taxable value of land and additions on the property. | Land | Improvement |
|---|---|---|---|---|
| 2025 | $1,814 | $123,891 | $37,495 | $86,396 |
| 2024 | $1,814 | $129,286 | $37,495 | $91,791 |
| 2023 | $1,727 | $65,740 | $0 | $0 |
| 2022 | $1,399 | $104,672 | $21,298 | $83,374 |
| 2021 | $1,200 | $76,157 | $18,949 | $57,208 |
| 2020 | $1,103 | $68,780 | $12,086 | $56,694 |
| 2019 | $1,020 | $61,880 | $12,086 | $49,794 |
| 2018 | $925 | $53,343 | $12,089 | $41,254 |
| 2017 | $843 | $43,869 | $10,780 | $33,089 |
| 2016 | $713 | $34,712 | $7,645 | $27,067 |
| 2015 | $664 | $30,383 | $6,809 | $23,574 |
| 2014 | $656 | $30,462 | $6,809 | $23,653 |
Source: Public Records
Map
Nearby Homes
- 10443 Raffia Dr
- 10517 Camelia Dr
- 10602 Camelia Dr
- 10401 Alice M Ct
- 10404 Loquat Dr
- 7118 Cherry Laurel Dr
- 10411 Paula Ct
- 7102 Cherry Laurel Dr
- 7234 Heath Dr Unit 2
- 7217 Coventry Dr
- 7338 Coventry Dr
- 7001 Heath Dr
- 7521 Bougenville Dr
- 7201 Rhinebeck Dr
- 7520 Valencia Ave
- 10211 Oleander Dr
- 10131 Glen Moor Ln
- 6919 Kingston Ct
- 10128 Cherry Creek Ln
- 10840 Norwood Ave
- 10521 Raffia Dr
- 10511 Raffia Dr
- 10527 Raffia Dr
- 10505 Raffia Dr
- 10516 Raffia Dr
- 7210 Arbutus Dr
- 10508 Raffia Dr
- 10530 Addison Dr
- 10533 Raffia Dr
- 7300 Tangelo Ave
- 7206 Arbutus Dr
- 7301 Orange Blossom Ave
- 10528 Raffia Dr Unit 2A
- 10534 Addison Dr
- 10537 Raffia Dr
- 10442 Raffia Dr
- 7306 Tangelo Ave
- 10437 Raffia Dr
- 7301 Tangelo Ave Unit 2B
- 7307 Orange Blossom Ave