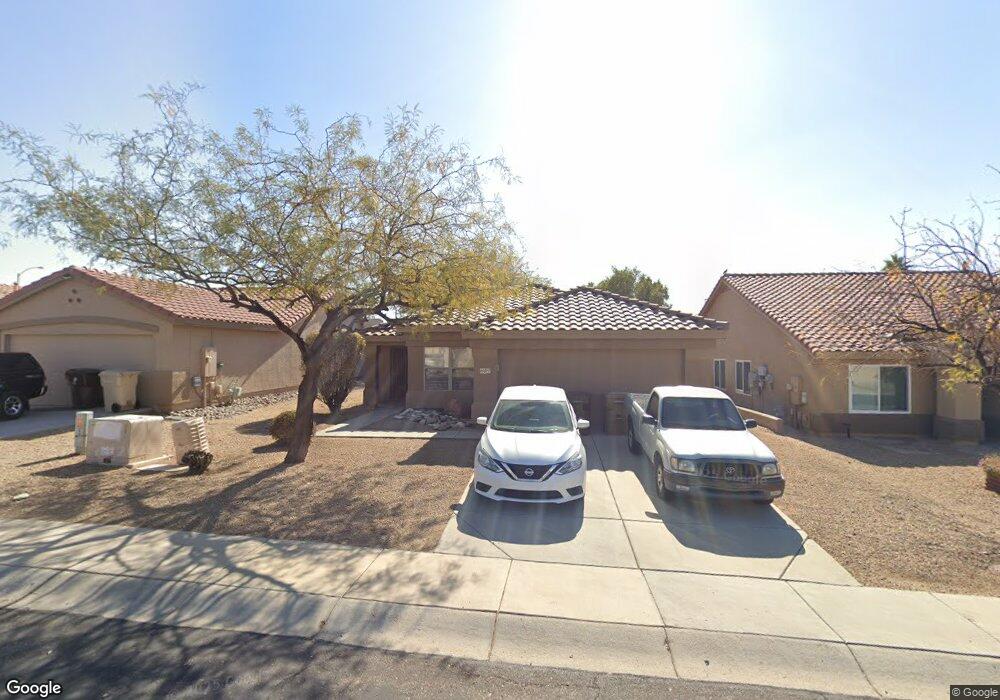
10517 W Via Montoya Dr Peoria, AZ 85383
Estimated Value: $353,000 - $370,000
3
Beds
2
Baths
1,231
Sq Ft
$294/Sq Ft
Est. Value
About This Home
This home is located at 10517 W Via Montoya Dr, Peoria, AZ 85383 and is currently estimated at $361,664, approximately $293 per square foot. 10517 W Via Montoya Dr is a home located in Maricopa County with nearby schools including Zuni Hills Elementary School, Liberty High School, and Candeo Peoria.
Ownership History
Date
Name
Owned For
Owner Type
Purchase Details
Closed on
Jan 31, 2022
Sold by
Blecher Steven T
Bought by
Blecher Steven T and Blecher Riley Todd
Current Estimated Value
Purchase Details
Closed on
Apr 21, 2004
Sold by
Schader Tyra and Culbertson Tyra M
Bought by
Blecher Steven T
Home Financials for this Owner
Home Financials are based on the most recent Mortgage that was taken out on this home.
Original Mortgage
$103,600
Interest Rate
5.86%
Mortgage Type
New Conventional
Purchase Details
Closed on
Jul 29, 1998
Sold by
Kaufman & Broad Home Sales Of Az Inc
Bought by
Culbertson Tyra M
Home Financials for this Owner
Home Financials are based on the most recent Mortgage that was taken out on this home.
Original Mortgage
$95,834
Interest Rate
6.73%
Mortgage Type
FHA
Create a Home Valuation Report for This Property
The Home Valuation Report is an in-depth analysis detailing your home's value as well as a comparison with similar homes in the area
Home Values in the Area
Average Home Value in this Area
Purchase History
| Date | Buyer | Sale Price | Title Company |
|---|---|---|---|
| Blecher Steven T | -- | -- | |
| Blecher Steven T | $129,500 | Grand Canyon Title Agency | |
| Culbertson Tyra M | $95,982 | First American Title | |
| Kaufman & Broad Home Sales Of Az Inc | -- | First American Title |
Source: Public Records
Mortgage History
| Date | Status | Borrower | Loan Amount |
|---|---|---|---|
| Previous Owner | Blecher Steven T | $103,600 | |
| Previous Owner | Culbertson Tyra M | $95,834 |
Source: Public Records
Tax History Compared to Growth
Tax History
| Year | Tax Paid | Tax Assessment Tax Assessment Total Assessment is a certain percentage of the fair market value that is determined by local assessors to be the total taxable value of land and additions on the property. | Land | Improvement |
|---|---|---|---|---|
| 2025 | $1,339 | $14,054 | -- | -- |
| 2024 | $1,311 | $13,385 | -- | -- |
| 2023 | $1,311 | $25,660 | $5,130 | $20,530 |
| 2022 | $1,285 | $19,320 | $3,860 | $15,460 |
| 2021 | $1,344 | $17,630 | $3,520 | $14,110 |
| 2020 | $1,353 | $16,330 | $3,260 | $13,070 |
| 2019 | $1,313 | $15,160 | $3,030 | $12,130 |
| 2018 | $1,265 | $13,670 | $2,730 | $10,940 |
| 2017 | $1,263 | $12,430 | $2,480 | $9,950 |
| 2016 | $1,247 | $11,630 | $2,320 | $9,310 |
| 2015 | $1,162 | $10,510 | $2,100 | $8,410 |
Source: Public Records
Map
Nearby Homes
- 10456 W Los Gatos Dr
- 10370 W Sands Dr Unit 463
- 10328 W Carlota Ln
- 10296 W Sands Dr Unit 485
- 22729 N 103rd Ln
- 22322 N 108th Ave
- 10226 W Country Club Trail
- 10446 W Lone Cactus Dr
- 10172 W Carlota Ln
- 21479 N 104th Dr
- 21379 N 105th Ave
- 10447 W Lone Cactus Dr
- 10894 W Alex Ave
- 22173 N 101st Dr
- 10549 W Albert Ln
- 00000 W Westwind Dr Unit 201-08-428
- 10536 W Villa Hermosa
- 10252 W Villa Chula
- 10806 W Adam Ave
- 10423 W Navigator Ln
- 10513 W Via Montoya Dr
- 10521 W Via Montoya Dr
- 10525 W Via Montoya Dr
- 10509 W Via Montoya Dr
- 10518 W Angels Ln
- 10514 W Angels Ln
- 10522 W Angels Ln Unit 2
- 10510 W Angels Ln
- 10529 W Via Montoya Dr
- 10526 W Angels Ln
- 10518 W Via Montoya Dr
- 10514 W Via Montoya Dr
- 10522 W Via Montoya Dr
- 10530 W Angels Ln
- 10526 W Via Montoya Dr
- 10510 W Via Montoya Dr
- 10533 W Via Montoya Dr Unit CLEAN
- 10533 W Via Montoya Dr
- 10530 W Via Montoya Dr
- 10536 W Angels Ln Unit 2