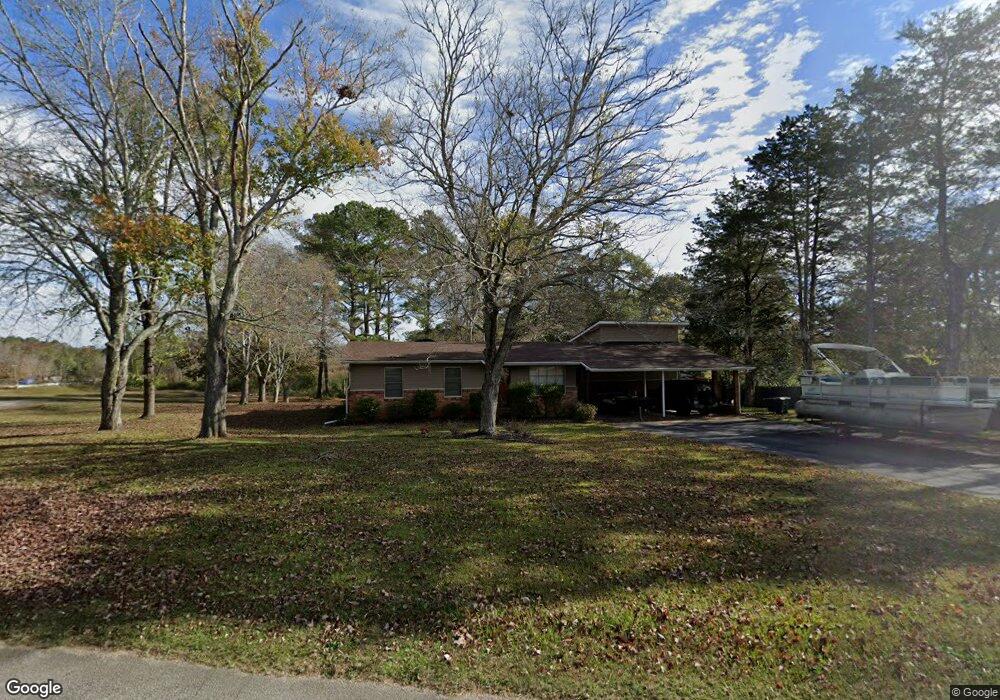
1052 Kathwood Drive Extension Elberton, GA 30635
Estimated Value: $176,000 - $204,908
--
Bed
2
Baths
1,958
Sq Ft
$98/Sq Ft
Est. Value
About This Home
This home is located at 1052 Kathwood Drive Extension, Elberton, GA 30635 and is currently estimated at $192,227, approximately $98 per square foot. 1052 Kathwood Drive Extension is a home located in Elbert County with nearby schools including Elbert County Elementary School, Elbert County Primary School, and Elbert County Middle School.
Ownership History
Date
Name
Owned For
Owner Type
Purchase Details
Closed on
Feb 24, 2006
Sold by
Federal National Mortgage Association
Bought by
Brown Keith M
Current Estimated Value
Home Financials for this Owner
Home Financials are based on the most recent Mortgage that was taken out on this home.
Original Mortgage
$71,250
Outstanding Balance
$39,982
Interest Rate
6.05%
Estimated Equity
$152,246
Purchase Details
Closed on
Dec 6, 2005
Sold by
Washington Mutual Bank
Bought by
Federal National Mtg Associati
Purchase Details
Closed on
Oct 15, 2003
Sold by
Eckler John Richie and Eckler Ann R
Bought by
Carithers Samuel B
Purchase Details
Closed on
Aug 1, 1974
Sold by
Dove Roy Norman and Dove Marian S
Bought by
Eckler John Richey and Eckler Ann R
Purchase Details
Closed on
Jan 1, 1961
Create a Home Valuation Report for This Property
The Home Valuation Report is an in-depth analysis detailing your home's value as well as a comparison with similar homes in the area
Home Values in the Area
Average Home Value in this Area
Purchase History
| Date | Buyer | Sale Price | Title Company |
|---|---|---|---|
| Brown Keith M | $75,000 | -- | |
| Federal National Mtg Associati | $58,945 | -- | |
| Washington Mutual Bank Fa | $58,945 | -- | |
| Carithers Samuel B | $78,000 | -- | |
| Eckler John Richey | $27,500 | -- | |
| -- | $11,000 | -- |
Source: Public Records
Mortgage History
| Date | Status | Borrower | Loan Amount |
|---|---|---|---|
| Open | Brown Keith M | $71,250 |
Source: Public Records
Tax History Compared to Growth
Tax History
| Year | Tax Paid | Tax Assessment Tax Assessment Total Assessment is a certain percentage of the fair market value that is determined by local assessors to be the total taxable value of land and additions on the property. | Land | Improvement |
|---|---|---|---|---|
| 2024 | $1,718 | $71,845 | $4,770 | $67,075 |
| 2023 | $1,718 | $71,845 | $4,770 | $67,075 |
| 2022 | $877 | $37,634 | $4,770 | $32,864 |
| 2021 | $883 | $37,634 | $4,770 | $32,864 |
| 2020 | $891 | $32,314 | $5,300 | $27,014 |
| 2019 | $920 | $32,314 | $5,300 | $27,014 |
| 2018 | $1,088 | $37,410 | $5,300 | $32,110 |
| 2017 | $1,093 | $34,773 | $5,300 | $29,473 |
| 2016 | $905 | $30,832 | $5,300 | $25,532 |
| 2015 | -- | $30,832 | $5,300 | $25,532 |
| 2014 | -- | $30,832 | $5,300 | $25,532 |
| 2013 | -- | $30,832 | $5,300 | $25,532 |
Source: Public Records
Map
Nearby Homes
- 0 Pulliam St Unit 7659662
- 0 Pulliam St Unit 10616872
- 1133 Kathwood Dr
- 243 W Tate St
- 1020 Hickory Dr
- 0 Sara Jane Dr Unit 10501253
- 1315 Pine Hill Dr
- 345 N Oliver St
- 346 N Oliver St
- 89 College Ave
- 44 Clairmont Ave
- 136 Forest Ave
- 170 Lake Forest Dr
- 968 Ext Elbert St
- 62 Oak St
- 108 Brookhaven Cir
- TRACT 4 Thornton Dr
- TRACT 1 Thornton Dr
- TRACT 2 THORNTO Thornton Dr
- TRACT 3 Thornton Dr
- 1051 Kathwood Drive Extension
- 1044 Kathwood Drive Extension
- 1058 Kathwood Drive Extension
- 1058 Kathwood Drive Extension
- 1058 Kathwood Drive Extension
- 1058 Kathwood Dr
- 1061 Kathwood Drive Extension
- 0 Kathwood Dr Unit 8420177
- 0 Kathwood Dr Unit 7163278
- 0 Kathwood Dr Unit 3185662
- 0 Kathwood Dr Unit 3135168
- 1063 Kathwood Drive Extension
- 1047 Kathwood Drive Extension
- 1067 Kathwood Dr
- 1067 1067 Kathwood Dr
- 1067 Kathwood Drive Extension
- 1043 Kathwood Drive Extension
- 1043 Kathwood Dr
- 1038 Miller Dr
- 1068 Kathwood Drive Extension