Estimated Value: $404,000 - $465,000
5
Beds
2
Baths
1,948
Sq Ft
$219/Sq Ft
Est. Value
About This Home
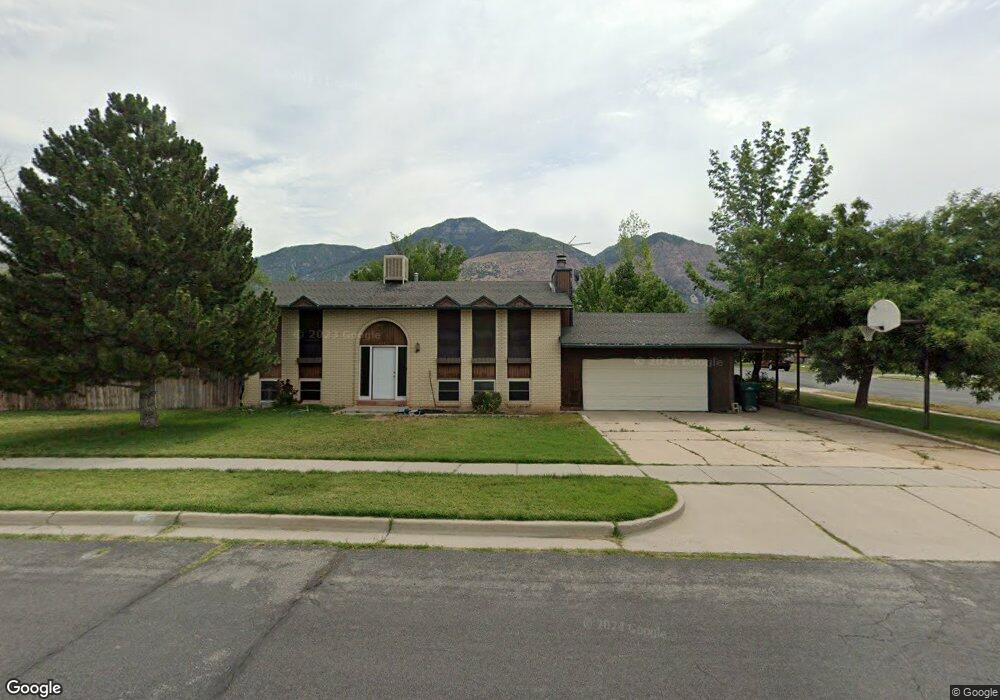
This home is located at 1052 N 275 E, Ogden, UT 84404 and is currently estimated at $427,235, approximately $219 per square foot. 1052 N 275 E is a home located in Weber County with nearby schools including Pioneer School, Orion Junior High School, and Fremont High School.
Ownership History
Date
Name
Owned For
Owner Type
Purchase Details
Closed on
Dec 28, 2011
Sold by
May Joel
Bought by
Price Jonathan L and Price Jessica L
Current Estimated Value
Home Financials for this Owner
Home Financials are based on the most recent Mortgage that was taken out on this home.
Original Mortgage
$129,628
Outstanding Balance
$88,912
Interest Rate
3.99%
Mortgage Type
FHA
Estimated Equity
$338,323
Purchase Details
Closed on
Jun 19, 2003
Sold by
Henzie May Niki
Bought by
May Joel
Home Financials for this Owner
Home Financials are based on the most recent Mortgage that was taken out on this home.
Original Mortgage
$132,909
Interest Rate
5.53%
Mortgage Type
FHA
Purchase Details
Closed on
Nov 6, 2002
Sold by
May Joel
Bought by
May Joel and Henzie May Niki
Home Financials for this Owner
Home Financials are based on the most recent Mortgage that was taken out on this home.
Original Mortgage
$130,945
Interest Rate
5.88%
Mortgage Type
FHA
Purchase Details
Closed on
Nov 5, 2002
Sold by
Wojtyna Eugene and Wojtyna Linda
Bought by
May Joel
Home Financials for this Owner
Home Financials are based on the most recent Mortgage that was taken out on this home.
Original Mortgage
$130,945
Interest Rate
5.88%
Mortgage Type
FHA
Create a Home Valuation Report for This Property
The Home Valuation Report is an in-depth analysis detailing your home's value as well as a comparison with similar homes in the area
Home Values in the Area
Average Home Value in this Area
Purchase History
| Date | Buyer | Sale Price | Title Company |
|---|---|---|---|
| Price Jonathan L | -- | Bonneville Superior Title Co | |
| May Joel | -- | Us Title | |
| May Joel | -- | Equity Title | |
| May Joel | -- | Heritage West |
Source: Public Records
Mortgage History
| Date | Status | Borrower | Loan Amount |
|---|---|---|---|
| Open | Price Jonathan L | $129,628 | |
| Previous Owner | May Joel | $132,909 | |
| Previous Owner | May Joel | $130,945 |
Source: Public Records
Tax History
| Year | Tax Paid | Tax Assessment Tax Assessment Total Assessment is a certain percentage of the fair market value that is determined by local assessors to be the total taxable value of land and additions on the property. | Land | Improvement |
|---|---|---|---|---|
| 2025 | $2,671 | $417,149 | $124,021 | $293,128 |
| 2024 | $2,580 | $225,499 | $68,211 | $157,288 |
| 2023 | $2,401 | $211,200 | $68,284 | $142,916 |
| 2022 | $2,306 | $206,250 | $62,835 | $143,415 |
| 2021 | $1,767 | $293,000 | $69,193 | $223,807 |
| 2020 | $1,685 | $259,000 | $54,517 | $204,483 |
| 2019 | $1,646 | $240,000 | $44,502 | $195,498 |
| 2018 | $1,569 | $219,000 | $42,521 | $176,479 |
| 2017 | $1,365 | $180,000 | $42,521 | $137,479 |
| 2016 | $1,311 | $93,615 | $22,237 | $71,378 |
| 2015 | $1,188 | $84,087 | $19,532 | $64,555 |
| 2014 | $1,105 | $76,865 | $19,532 | $57,333 |
Source: Public Records
Map
Nearby Homes
- 2106 W 2000 N
- 1013 N 450 St E Unit 60
- 116 E 1150 N
- 448 E 900 N Unit 6
- 461 E 960 N
- 1252 N 300 E Unit 180
- 1256 N 300 E Unit 179
- 835 N Washington Blvd Unit 1,2
- 1262 N 300 E Unit 178
- 1268 N 300 E Unit 177
- 1263 N 325 E Unit 173
- 302 E 1275 N Unit 109
- 318 E 1275 N Unit 115
- 322 E 1275 N Unit 117
- 324 E 1275 N Unit 118
- 328 E 1275 N Unit 120
- 330 E 1275 N Unit 121
- 1273 N 375 E Unit 153
- 511 E 950 N Unit 34
- 1259 N 450 E Unit 2
Your Personal Tour Guide
Ask me questions while you tour the home.