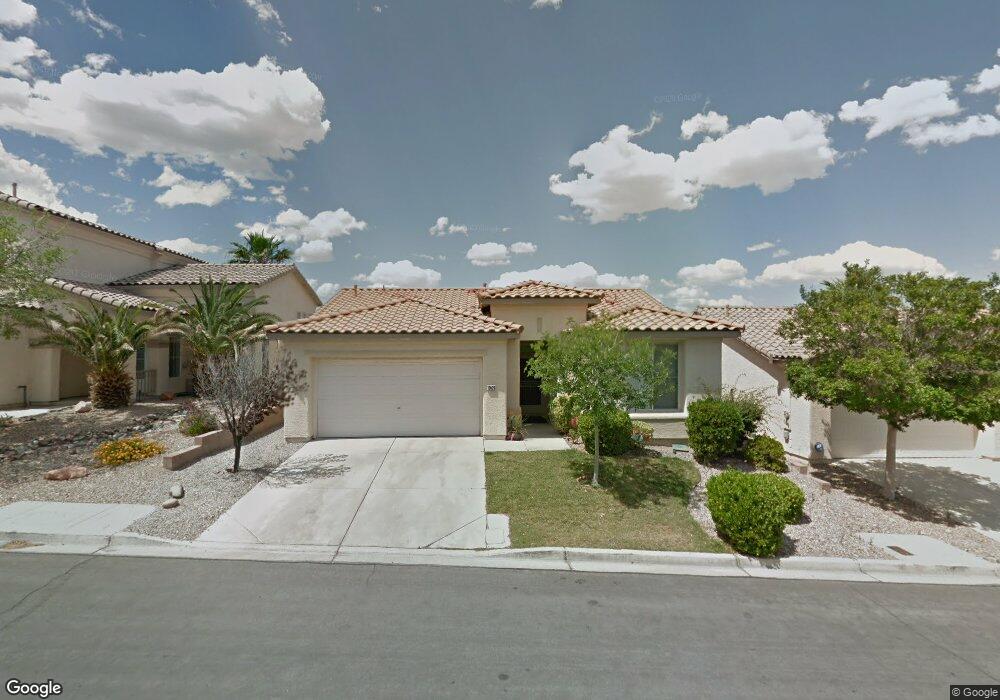
10520 Angel Dreams Ave Unit n/a Las Vegas, NV 89144
Summerlin NeighborhoodEstimated Value: $418,167 - $448,000
2
Beds
2
Baths
1,144
Sq Ft
$377/Sq Ft
Est. Value
About This Home
This home is located at 10520 Angel Dreams Ave Unit n/a, Las Vegas, NV 89144 and is currently estimated at $431,292, approximately $377 per square foot. 10520 Angel Dreams Ave Unit n/a is a home located in Clark County with nearby schools including Ethel W. Staton Elementary School, Sig Rogich Middle School, and Palo Verde High School.
Ownership History
Date
Name
Owned For
Owner Type
Purchase Details
Closed on
Aug 7, 2015
Sold by
Le Randy Tu and Le Paula Phuong
Bought by
Church Kendall
Current Estimated Value
Purchase Details
Closed on
Apr 22, 2013
Sold by
Lee Randy and Lee Paula
Bought by
Le Randy Tu and Le Paula Phuong
Purchase Details
Closed on
Sep 20, 2012
Sold by
Bezalel Helen R
Bought by
Le Randy and Le Paula
Purchase Details
Closed on
Nov 15, 2004
Sold by
Erichsen Richard and Erichsen Phyllis
Bought by
Bezalel Helen R
Home Financials for this Owner
Home Financials are based on the most recent Mortgage that was taken out on this home.
Original Mortgage
$215,200
Interest Rate
6.85%
Mortgage Type
Unknown
Purchase Details
Closed on
Dec 8, 1998
Sold by
Capital Pacific Holdings Llc
Bought by
Erichsen Richard and Erichsen Phyllis
Create a Home Valuation Report for This Property
The Home Valuation Report is an in-depth analysis detailing your home's value as well as a comparison with similar homes in the area
Home Values in the Area
Average Home Value in this Area
Purchase History
| Date | Buyer | Sale Price | Title Company |
|---|---|---|---|
| Church Kendall | $195,900 | Nevada Title Las Vegas | |
| Le Randy Tu | -- | None Available | |
| Le Randy | $125,000 | National Title Company | |
| Bezalel Helen R | $269,000 | Chicago Title | |
| Erichsen Richard | $117,000 | First American Title Co |
Source: Public Records
Mortgage History
| Date | Status | Borrower | Loan Amount |
|---|---|---|---|
| Previous Owner | Bezalel Helen R | $215,200 | |
| Closed | Bezalel Helen R | $53,800 |
Source: Public Records
Tax History Compared to Growth
Tax History
| Year | Tax Paid | Tax Assessment Tax Assessment Total Assessment is a certain percentage of the fair market value that is determined by local assessors to be the total taxable value of land and additions on the property. | Land | Improvement |
|---|---|---|---|---|
| 2025 | $2,377 | $96,327 | $46,200 | $50,127 |
| 2024 | $2,202 | $96,327 | $46,200 | $50,127 |
| 2023 | $2,202 | $82,481 | $35,000 | $47,481 |
| 2022 | $2,039 | $68,994 | $25,550 | $43,444 |
| 2021 | $1,888 | $66,226 | $24,850 | $41,376 |
| 2020 | $1,750 | $65,577 | $24,500 | $41,077 |
| 2019 | $1,640 | $62,517 | $22,050 | $40,467 |
| 2018 | $1,565 | $56,318 | $17,150 | $39,168 |
| 2017 | $1,819 | $55,294 | $15,750 | $39,544 |
| 2016 | $1,466 | $51,508 | $11,900 | $39,608 |
| 2015 | $1,462 | $46,267 | $9,100 | $37,167 |
| 2014 | $1,417 | $44,698 | $7,350 | $37,348 |
Source: Public Records
Map
Nearby Homes
- 10500 Shanna Trellis Ave
- 10665 Hillock Ct
- 1748 Pacific Breeze Dr
- 10407 Sawmill Ave
- 1709 Pacific Panorama Place
- 10525 Mission Lakes Ave
- 1900 Bellview St
- 10400 Sawmill Ave
- 1904 Bellview St
- 1716 Pacific Castle Place
- 2009 Emery St
- 10525 Findlay Ave
- 1609 Queen Victoria St Unit 201
- 10648 Clarion Ln
- 10309 Cogswell Ave
- 1704 Queen Victoria St Unit 102
- 10260 Copparo Place Unit 4
- 10725 Mission Lakes Ave
- 10224 Anoka Ave
- 10528 Cogswell Ave
- 10520 Angel Dreams Ave
- 10524 Angel Dreams Ave
- 10521 Jeremy Pointe Ave
- 10525 Jeremy Pointe Ave Unit 3
- 10517 Jeremy Pointe Ave
- 10512 Angel Dreams Ave
- 10528 Angel Dreams Ave Unit 2
- 10521 Angel Dreams Ave
- 10525 Angel Dreams Ave Unit 2
- 10513 Jeremy Pointe Ave Unit 3
- 10529 Jeremy Pointe Ave
- 10517 Angel Dreams Ave
- 10508 Angel Dreams Ave
- 10529 Angel Dreams Ave
- 10529 Angel Dreams Ave Unit n/a
- 10509 Jeremy Pointe Ave
- 10509 Angel Dreams Ave
- 10504 Angel Dreams Ave Unit 2
- 10520 Jeremy Pointe Ave Unit n/a
- 10520 Jeremy Pointe Ave