10520 W Hall Rd Roscommon, MI 48653
Estimated Value: $67,587 - $184,000
3
Beds
2
Baths
2,496
Sq Ft
$47/Sq Ft
Est. Value
About This Home
This home is located at 10520 W Hall Rd, Roscommon, MI 48653 and is currently estimated at $117,897, approximately $47 per square foot. 10520 W Hall Rd is a home located in Crawford County with nearby schools including Roscommon Elementary School, Roscommon Middle School, and Roscommon High School.
Ownership History
Date
Name
Owned For
Owner Type
Purchase Details
Closed on
Apr 1, 2013
Sold by
Odonnell Timothy Alan
Bought by
Hickey Creek Lodge Llc
Current Estimated Value
Purchase Details
Closed on
Jul 8, 2009
Bought by
O'Donnell Tim O
Purchase Details
Closed on
Jun 29, 2009
Bought by
O'Donnell Timothy Allen
Purchase Details
Closed on
Nov 7, 2008
Sold by
Mcdonald John B Deputy
Bought by
Hsbc Mortgage Svcs, Inc
Purchase Details
Closed on
May 7, 2008
Bought by
Hsbc Mortgage Services, Inc
Purchase Details
Closed on
Jan 5, 2007
Sold by
Legg Melbourne E Pers Rep
Bought by
Legg Melbourne E
Purchase Details
Closed on
Nov 23, 2005
Sold by
Kummer Carl J and Kummer Ann M
Bought by
Foreman Charles
Purchase Details
Closed on
Mar 5, 2004
Sold by
Kummer Carl and Ann Marie
Bought by
Foreman Charles
Purchase Details
Closed on
May 29, 1998
Sold by
Fishell Larry B and Fishell Georgia M
Bought by
Kummer Carl and Ann Marie
Purchase Details
Closed on
May 24, 1991
Bought by
Fishell
Create a Home Valuation Report for This Property
The Home Valuation Report is an in-depth analysis detailing your home's value as well as a comparison with similar homes in the area
Purchase History
| Date | Buyer | Sale Price | Title Company |
|---|---|---|---|
| Hickey Creek Lodge Llc | -- | -- | |
| O'Donnell Tim O | $15,000 | -- | |
| O'Donnell Timothy Allen | $15,000 | -- | |
| Hsbc Mortgage Svcs, Inc | $38,900 | -- | |
| Hsbc Mortgage Services, Inc | $79,200 | -- | |
| Legg Melbourne E | -- | -- | |
| Foreman Charles | $74,000 | -- | |
| Foreman Charles | $74,000 | -- | |
| Kummer Carl | $56,900 | -- | |
| Fishell | $48,000 | -- |
Source: Public Records
Tax History
| Year | Tax Paid | Tax Assessment Tax Assessment Total Assessment is a certain percentage of the fair market value that is determined by local assessors to be the total taxable value of land and additions on the property. | Land | Improvement |
|---|---|---|---|---|
| 2025 | $210 | $30,000 | $30,000 | $0 |
| 2024 | $206 | $28,500 | $28,500 | $0 |
| 2023 | $197 | $24,100 | $24,100 | $0 |
| 2022 | $187 | $20,200 | $20,200 | $0 |
| 2021 | $816 | $19,000 | $19,000 | $0 |
| 2020 | $781 | $18,800 | $18,800 | $0 |
| 2019 | $763 | $16,800 | $16,800 | $0 |
| 2018 | $750 | $14,500 | $14,500 | $0 |
| 2017 | $169 | $14,000 | $14,000 | $0 |
| 2016 | $169 | $13,900 | $13,900 | $0 |
| 2015 | -- | $13,900 | $0 | $0 |
| 2014 | -- | $14,900 | $0 | $0 |
| 2013 | -- | $13,500 | $0 | $0 |
Source: Public Records
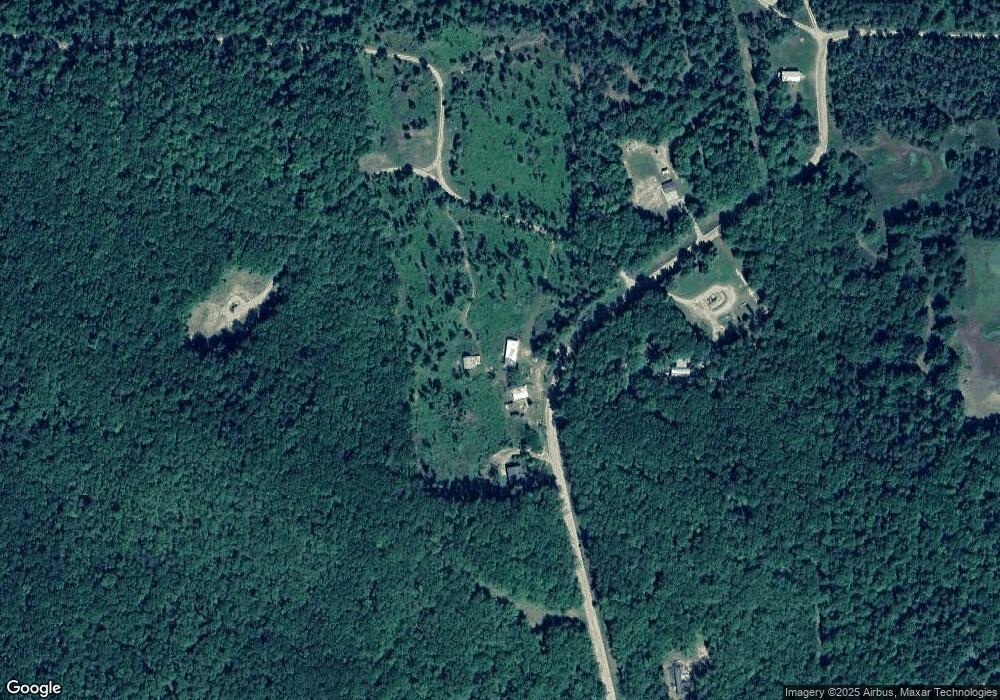
Map
Nearby Homes
- 0 Hall Rd
- 11585 S Flooter Rd
- 4801 Livingstone Rd
- 7808 Pautesa Dr
- lot 10 Pautesa Dr
- 7808 Pautesa Dr
- 11875 Hoetzel Rd
- 3776 E Michigan Hwy
- 2948 E Michigan Hwy
- 0 Chase Bridge Rd
- LOT #42 E Roberta Dr
- Lots 26-27 W Roberta Dr
- 10526 F-97
- 218 E Skyline Dr
- 1941 High Rd
- 108 Deerwood Ct
- Lot 98 Indian Wood Dr
- Lot 122 Aberdeen Cir
- 11491 Pines Trail
- 38 S Eugene Dr
- 10662 W Hall Rd
- 10605 S Hall Rd
- 10682 W Hall Rd
- 10861 S Hall Rd
- 6059 E Pioneer Rd
- 6006 E Pioneer Rd
- 5964 E Pioneer Rd
- 5900 E Pioneer Rd
- 6210 E Pioneer Rd
- 10805 Cingano Dr
- 11071 S Townline Rd
- 10728 Willows Rd
- 10728 Willows Rd
- 10804 Cingano Dr
- 10901 Cingano Dr
- 5816 E Pioneer Rd
- 6480 E Pioneer Rd
- 10865 Cingano Dr
- 10866 Cingano Dr
- 11067 S Townline
Your Personal Tour Guide
Ask me questions while you tour the home.