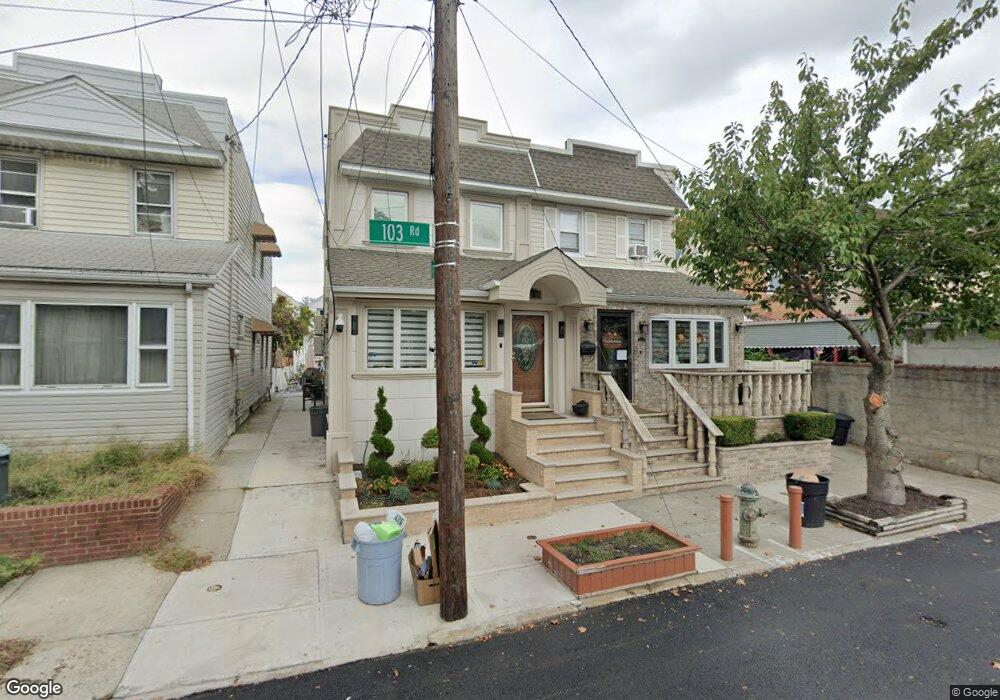
10521 103rd Rd Ozone Park, NY 11417
Richmond Hill NeighborhoodEstimated Value: $692,000 - $744,000
--
Bed
--
Bath
1,372
Sq Ft
$524/Sq Ft
Est. Value
About This Home
This home is located at 10521 103rd Rd, Ozone Park, NY 11417 and is currently estimated at $718,365, approximately $523 per square foot. 10521 103rd Rd is a home located in Queens County with nearby schools including P.S. 65 - The Raymond York Elementary School, Robert H. Goddard High School, and John Adams High School.
Ownership History
Date
Name
Owned For
Owner Type
Purchase Details
Closed on
Jul 11, 2008
Sold by
Khan Hashim A and Khan Nealawattie
Bought by
Torres Sergio
Current Estimated Value
Home Financials for this Owner
Home Financials are based on the most recent Mortgage that was taken out on this home.
Original Mortgage
$396,000
Outstanding Balance
$259,073
Interest Rate
6.35%
Estimated Equity
$459,292
Purchase Details
Closed on
Jan 31, 2001
Sold by
Chakra Holding Corp
Bought by
Khan Hashim A and Khan Nealawattie
Home Financials for this Owner
Home Financials are based on the most recent Mortgage that was taken out on this home.
Original Mortgage
$202,500
Interest Rate
7%
Purchase Details
Closed on
Jun 20, 2000
Sold by
Casella Nancy and Casella Jack
Bought by
Chakra Holding Corp
Purchase Details
Closed on
Jul 3, 1997
Sold by
Vitale Anna
Bought by
Casella Jack and Casella Nancy
Purchase Details
Closed on
Jun 30, 1995
Sold by
Vitale Anna and Vitale Catherine
Bought by
Vitale Anna
Create a Home Valuation Report for This Property
The Home Valuation Report is an in-depth analysis detailing your home's value as well as a comparison with similar homes in the area
Home Values in the Area
Average Home Value in this Area
Purchase History
| Date | Buyer | Sale Price | Title Company |
|---|---|---|---|
| Torres Sergio | $452,000 | -- | |
| Torres Sergio | $452,000 | -- | |
| Khan Hashim A | $255,000 | Stewart Title | |
| Khan Hashim A | $255,000 | Stewart Title | |
| Chakra Holding Corp | $158,500 | Commonwealth Land Title Ins | |
| Chakra Holding Corp | $158,500 | Commonwealth Land Title Ins | |
| Casella Jack | $158,000 | -- | |
| Casella Jack | $158,000 | -- | |
| Vitale Anna | -- | -- | |
| Vitale Anna | -- | -- |
Source: Public Records
Mortgage History
| Date | Status | Borrower | Loan Amount |
|---|---|---|---|
| Open | Torres Sergio | $396,000 | |
| Closed | Torres Sergio | $396,000 | |
| Previous Owner | Khan Hashim A | $202,500 |
Source: Public Records
Tax History Compared to Growth
Tax History
| Year | Tax Paid | Tax Assessment Tax Assessment Total Assessment is a certain percentage of the fair market value that is determined by local assessors to be the total taxable value of land and additions on the property. | Land | Improvement |
|---|---|---|---|---|
| 2025 | $5,432 | $30,025 | $6,055 | $23,970 |
| 2024 | $5,444 | $28,445 | $5,784 | $22,661 |
| 2023 | $5,173 | $27,158 | $5,822 | $21,336 |
| 2022 | $4,957 | $34,380 | $8,760 | $25,620 |
| 2021 | $5,085 | $34,620 | $8,760 | $25,860 |
| 2020 | $5,000 | $32,580 | $8,760 | $23,820 |
| 2019 | $4,666 | $32,460 | $8,760 | $23,700 |
| 2018 | $4,316 | $22,632 | $7,106 | $15,526 |
| 2017 | $4,094 | $21,556 | $7,285 | $14,271 |
| 2016 | $3,863 | $21,556 | $7,285 | $14,271 |
| 2015 | $2,233 | $20,851 | $6,875 | $13,976 |
| 2014 | $2,233 | $19,754 | $7,819 | $11,935 |
Source: Public Records
Map
Nearby Homes
- 103-10 106th St
- 10349A 104th St
- 103-22 104th St
- 105-02 Liberty Ave
- 10417 106th St
- 10805 103rd Ave
- 103-18 103rd St
- 10438 107th St
- 10152 103rd St
- 103-37 102nd St
- 10370 103rd St
- 103-50 102nd St
- 10154 102nd St
- 10208 101st Ave
- 97-17 106th St
- 107-16 103rd St
- 100-08 101st Ave
- 10728 108th St
- 97-39 110 St
- 10728 109th St
- 10519 103rd Rd
- 10517 103rd Rd
- 105-17 103rd Rd
- 10515 103rd Rd
- 10314 106th St
- 103-14 106th St
- 10515 103rd Rd
- 10316 106th St
- 10312 106th St
- 10318 106th St
- 103-12 106th St
- 10513 103rd Rd
- 10310 106th St
- 103-22 106th St
- 10320 106th St
- 10522 103rd Ave
- 10511 103rd Rd
- 105-11 103rd Rd
- 10520 103rd Ave
- 10308 106th St