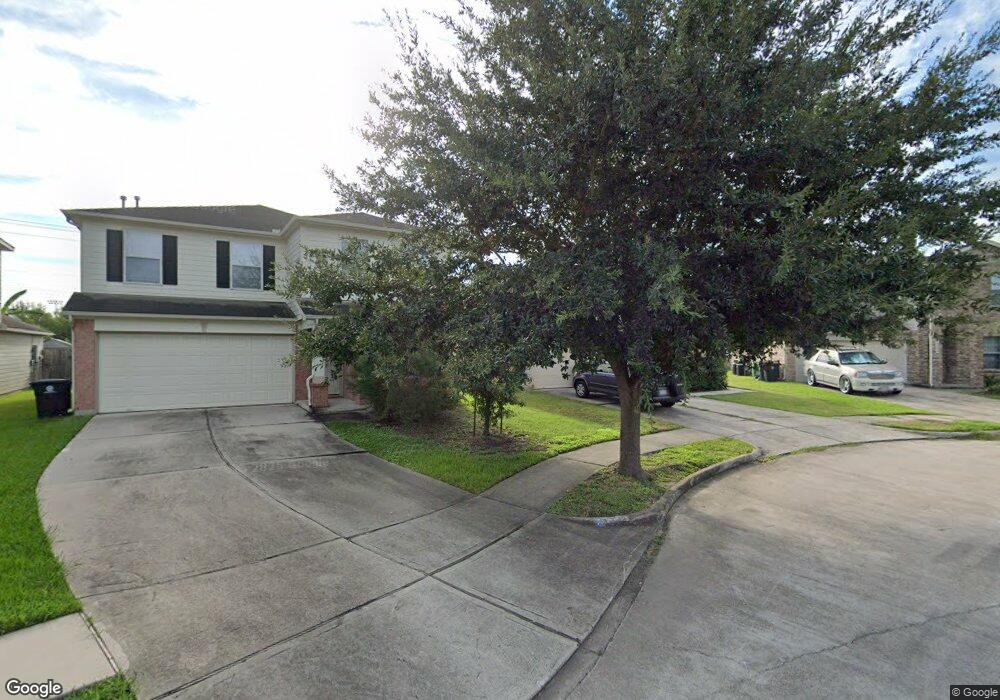
10523 Clark Grove Ln Houston, TX 77075
Southbelt-Ellington NeighborhoodEstimated Value: $257,415 - $260,000
3
Beds
2
Baths
1,638
Sq Ft
$158/Sq Ft
Est. Value
About This Home
This home is located at 10523 Clark Grove Ln, Houston, TX 77075 and is currently estimated at $258,604, approximately $157 per square foot. 10523 Clark Grove Ln is a home located in Harris County with nearby schools including Laura Welch Bush Elementary School, Morris Middle School, and Beverly Hill Intermediate School.
Ownership History
Date
Name
Owned For
Owner Type
Purchase Details
Closed on
Sep 26, 2006
Sold by
Centex Homes
Bought by
Ingram Ronald and Ingram Rose
Current Estimated Value
Home Financials for this Owner
Home Financials are based on the most recent Mortgage that was taken out on this home.
Original Mortgage
$143,374
Outstanding Balance
$85,790
Interest Rate
6.51%
Mortgage Type
Purchase Money Mortgage
Estimated Equity
$172,814
Create a Home Valuation Report for This Property
The Home Valuation Report is an in-depth analysis detailing your home's value as well as a comparison with similar homes in the area
Home Values in the Area
Average Home Value in this Area
Purchase History
| Date | Buyer | Sale Price | Title Company |
|---|---|---|---|
| Ingram Ronald | -- | Commerce Title Co |
Source: Public Records
Mortgage History
| Date | Status | Borrower | Loan Amount |
|---|---|---|---|
| Open | Ingram Ronald | $143,374 |
Source: Public Records
Tax History Compared to Growth
Tax History
| Year | Tax Paid | Tax Assessment Tax Assessment Total Assessment is a certain percentage of the fair market value that is determined by local assessors to be the total taxable value of land and additions on the property. | Land | Improvement |
|---|---|---|---|---|
| 2025 | $1,070 | $233,010 | $42,140 | $190,870 |
| 2024 | $1,070 | $243,319 | $42,140 | $201,179 |
| 2023 | $1,070 | $243,319 | $42,140 | $201,179 |
| 2022 | $6,148 | $224,743 | $42,140 | $182,603 |
| 2021 | $5,880 | $186,291 | $37,182 | $149,109 |
| 2020 | $5,859 | $179,108 | $37,182 | $141,926 |
| 2019 | $5,769 | $170,983 | $37,182 | $133,801 |
| 2018 | $36 | $152,775 | $31,366 | $121,409 |
| 2017 | $4,930 | $147,867 | $31,366 | $116,501 |
| 2016 | $4,752 | $143,388 | $28,752 | $114,636 |
| 2015 | $1,838 | $132,409 | $26,138 | $106,271 |
| 2014 | $1,838 | $123,394 | $26,138 | $97,256 |
Source: Public Records
Map
Nearby Homes
- 9319 Canady Park Ln
- 7329 Madison Commons Ln
- 7322 Madison Commons Ln
- 10518 Tenleyton Ln
- 0 Fuqua St Unit 64883593
- 0 Fuqua St Unit 45902141
- 0 Fuqua St Unit 97219329
- 10831 Cayman Mist Dr
- 9423 Garden Bridge St
- 10827 Linden Gate Dr
- 10506 Pleasant Villas Ln
- 10406 Sutter Glen Ln
- 10610 Stover St
- 9307 Fuqua Ridge Ln
- 10918 Linden Gate Dr
- 9602 Sumerlin St
- 9610 Sumerlin St
- 10934 Bradford Way Dr
- 10223 Belcamp Ct
- 10906 Stover St
- 10519 Clark Grove Ln
- 9346 Canaday Park Ln
- 10515 Clark Grove Ln
- 9342 Canady Park Ln
- 9342 Canady Park Ln
- 10511 Clark Grove Ln
- 9338 Canaday Park Ln
- 9338 Canady Park Ln
- 9339 Canaday Park Ln
- 10507 Clark Grove Ln
- 9334 Canaday Park Ln
- 9335 Canaday Park Ln
- 9335 Canady Park Ln
- 10503 Clark Grove Ln
- 9330 Canaday Park Ln
- 9330 Canady Park Ln
- 9338 Garfield Park Ln
- 9331 Canady Park Ln
- 9334 Garfield Park Ln
- 10427 Clark Grove Ln